Helpful review habit
Confirm the selected view, grouping, Hide Zero Balance Rows setting, and date range before you interpret any variance, because those controls can change the meaning of the table quickly.
Ask the support agent
Just ask a direct question or search related articles from the Knowledge Base.
Support Center / Flux Analysis / Overview
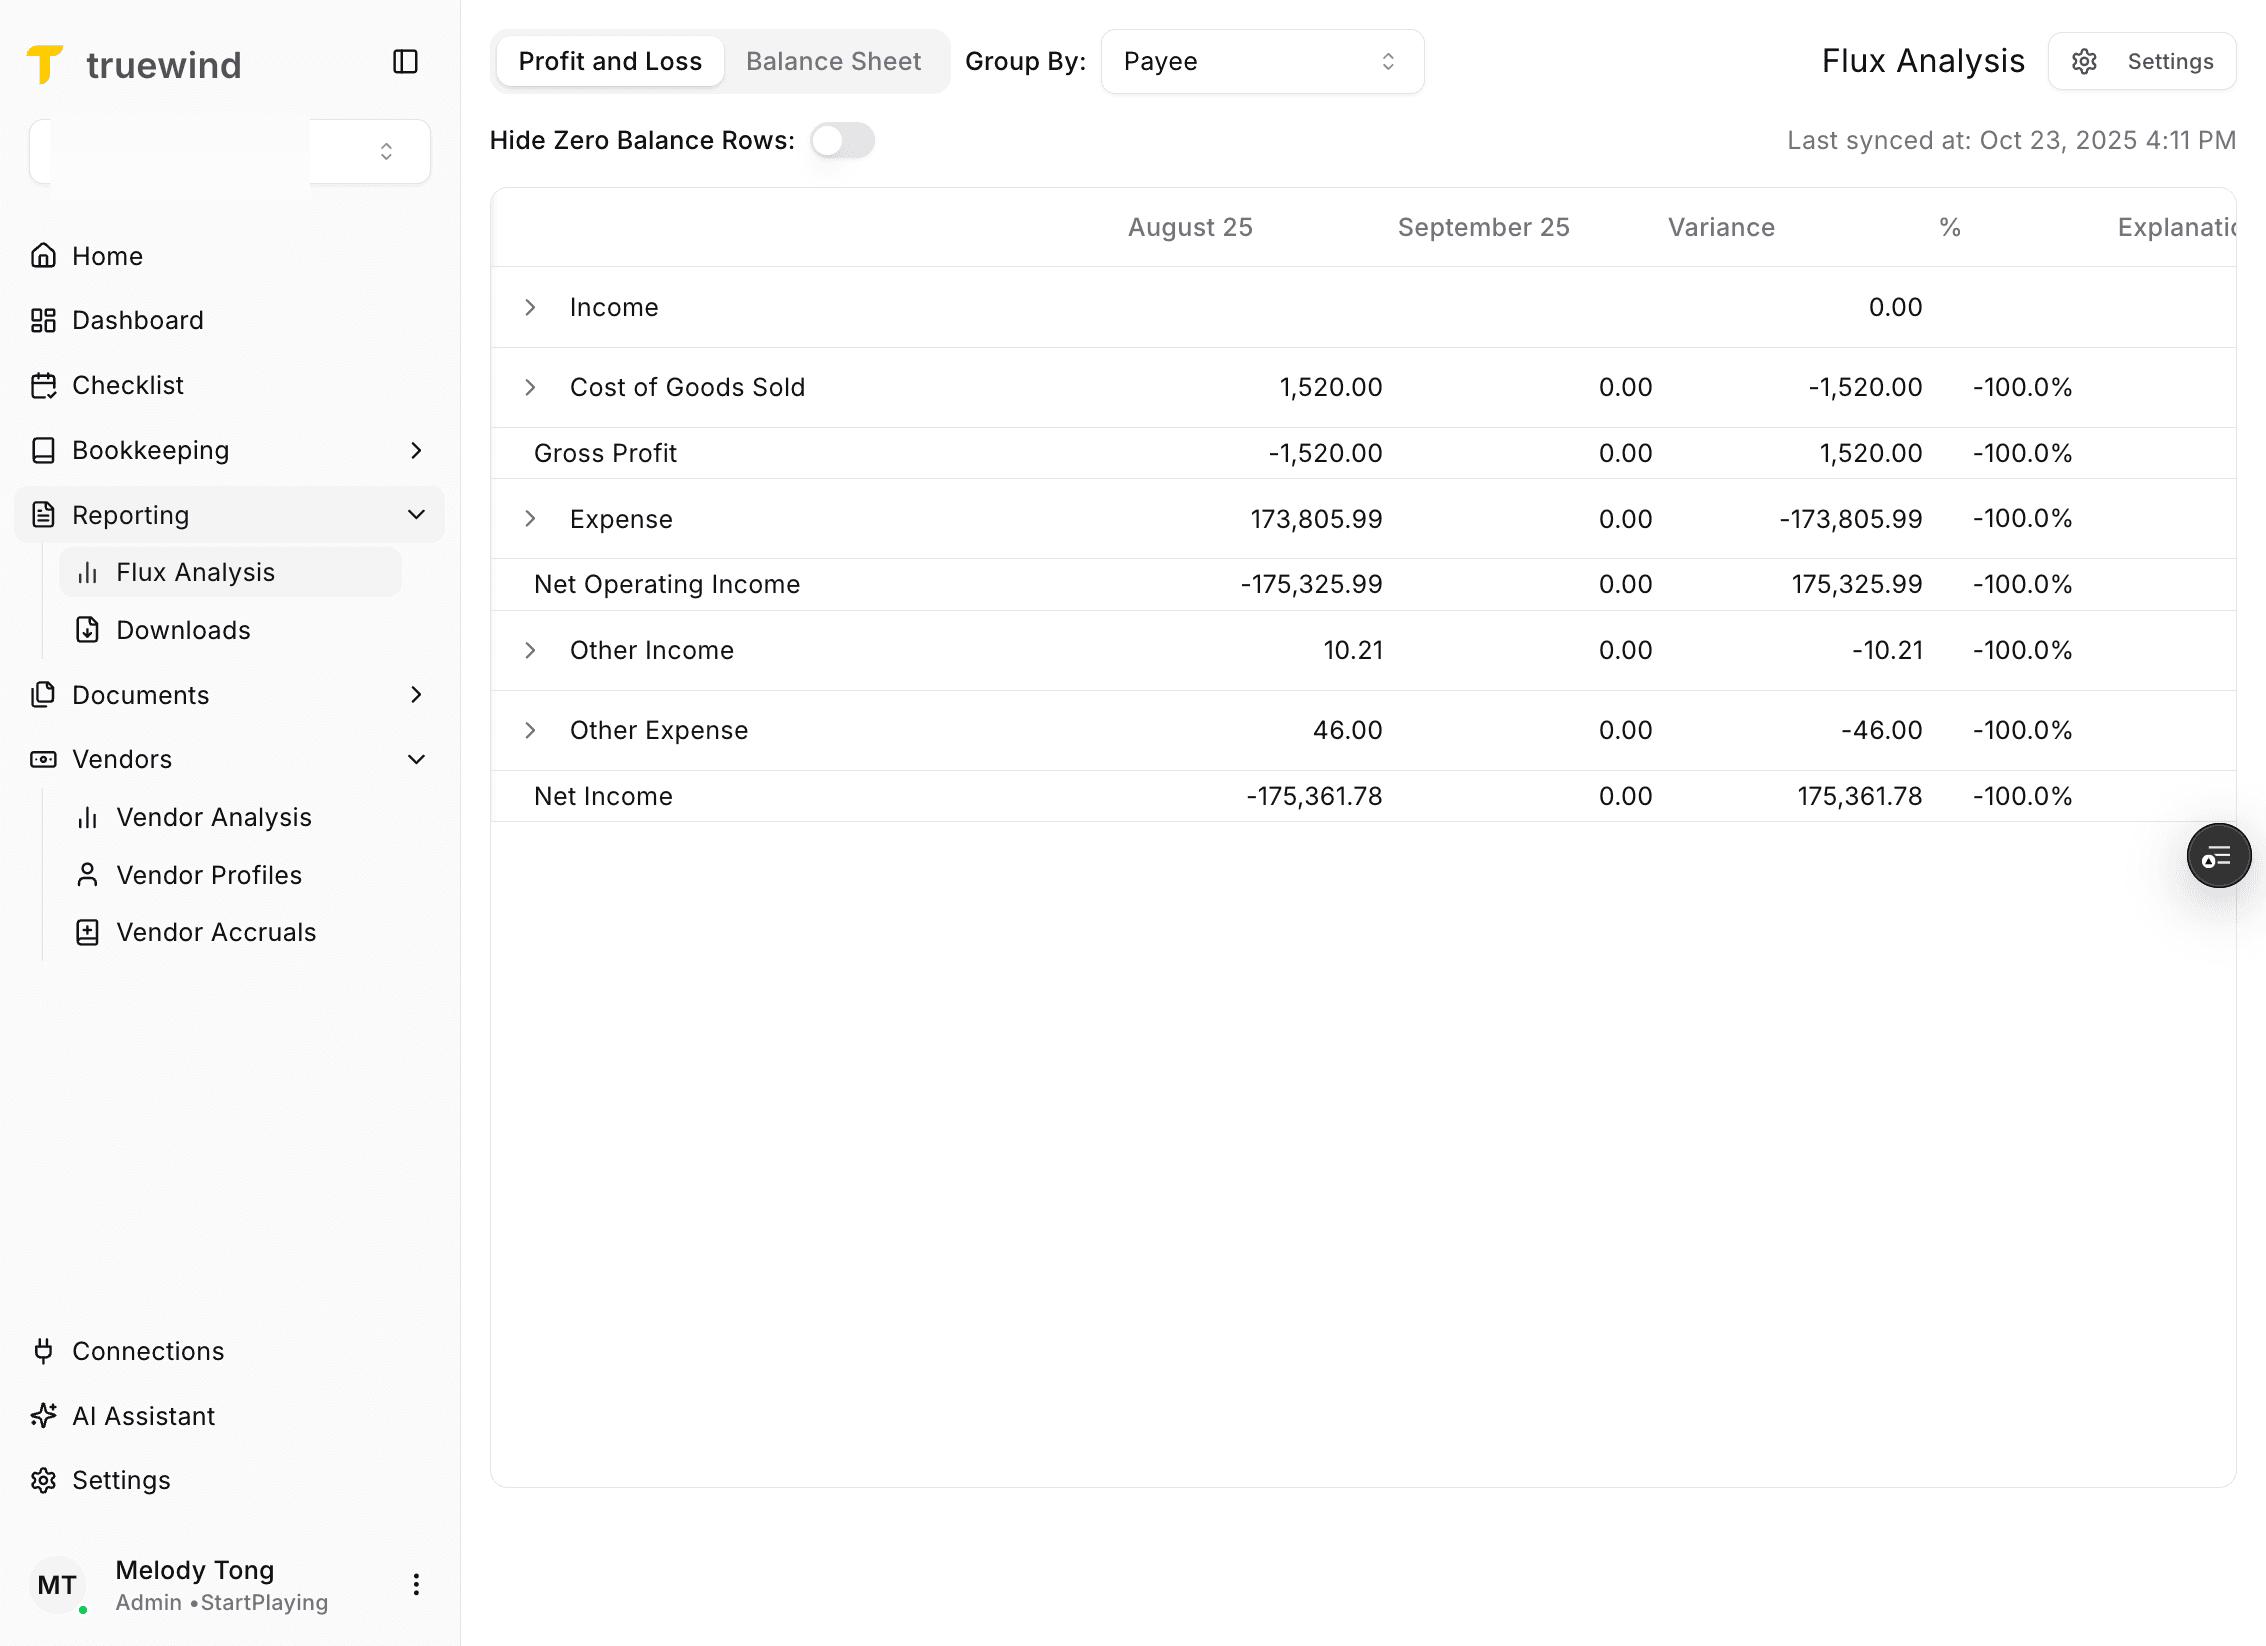
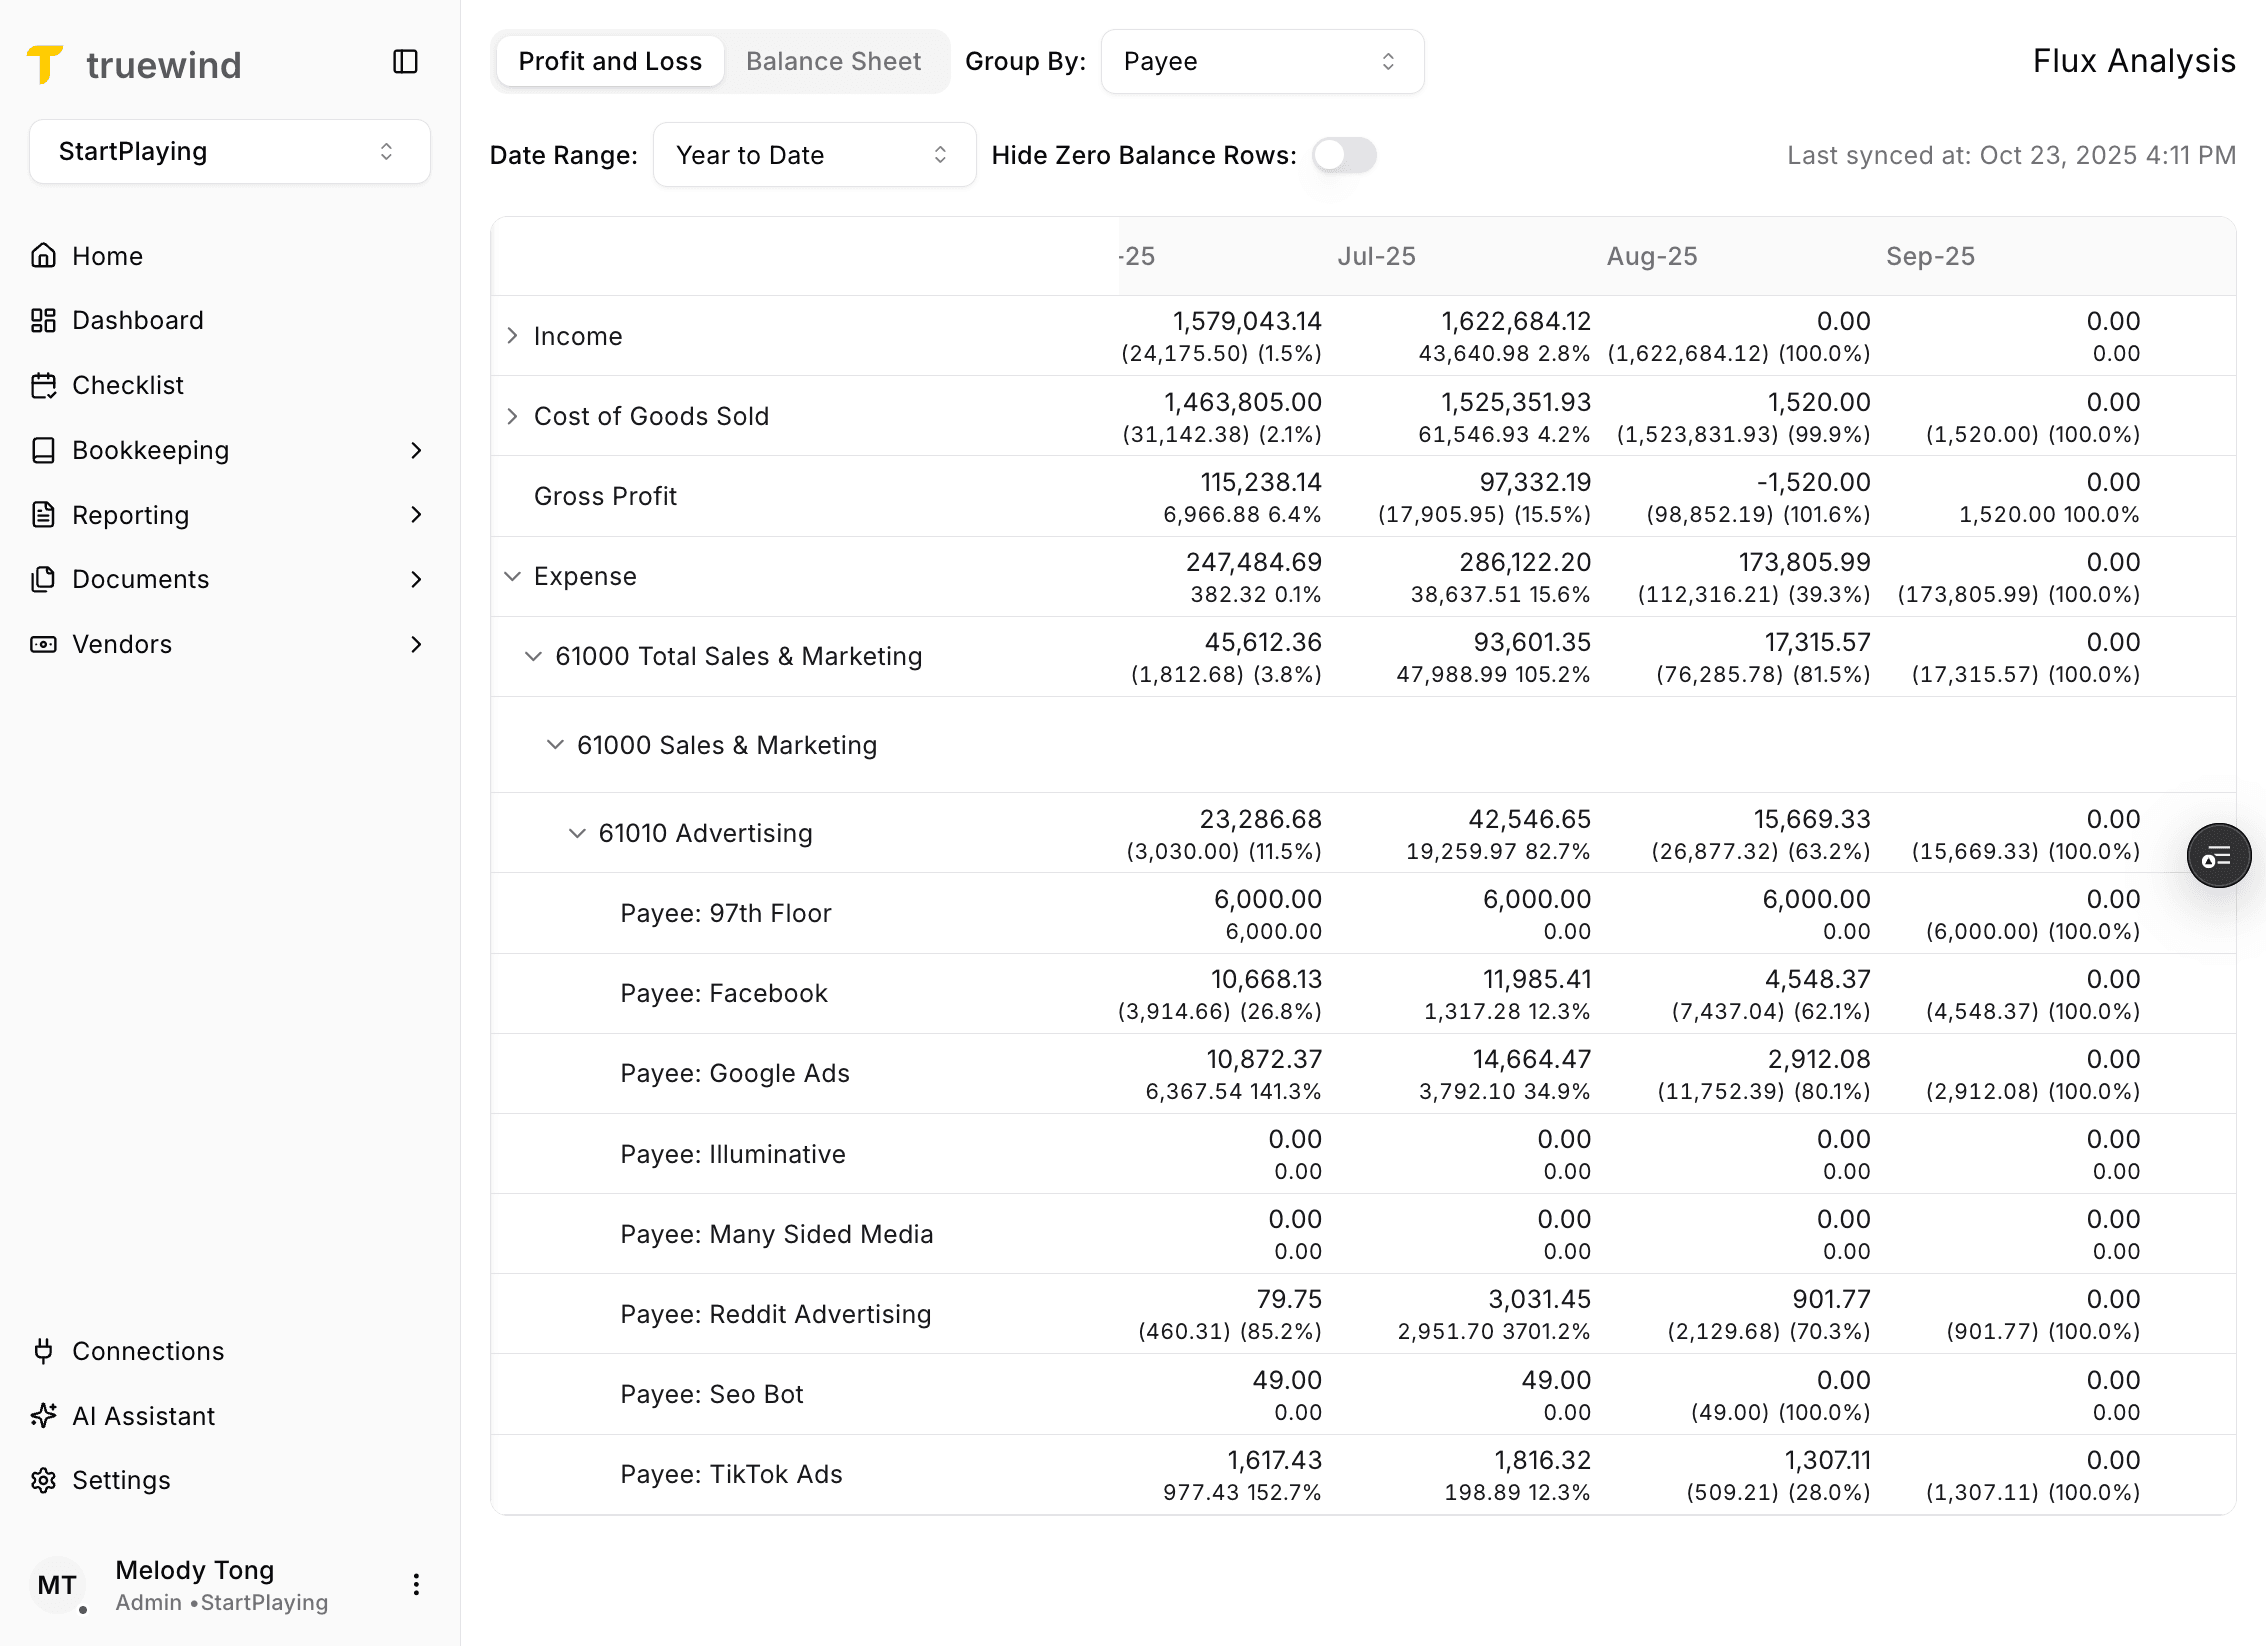
Open Flux Analysis when you need to inspect period-over-period balance movement, resulting in a grouped variance table for account, vendor, and detailed trend review.
Step 1
Start in Truewind on Reporting so you can access Flux Analysis from the reporting navigation.
Step 2
This opens the Flux Analysis page and loads the current controls and variance table.

Step 3
Flux Analysis supports both Profit and Loss and Balance Sheet views, so confirm which financial statement you want to investigate first.
Step 4
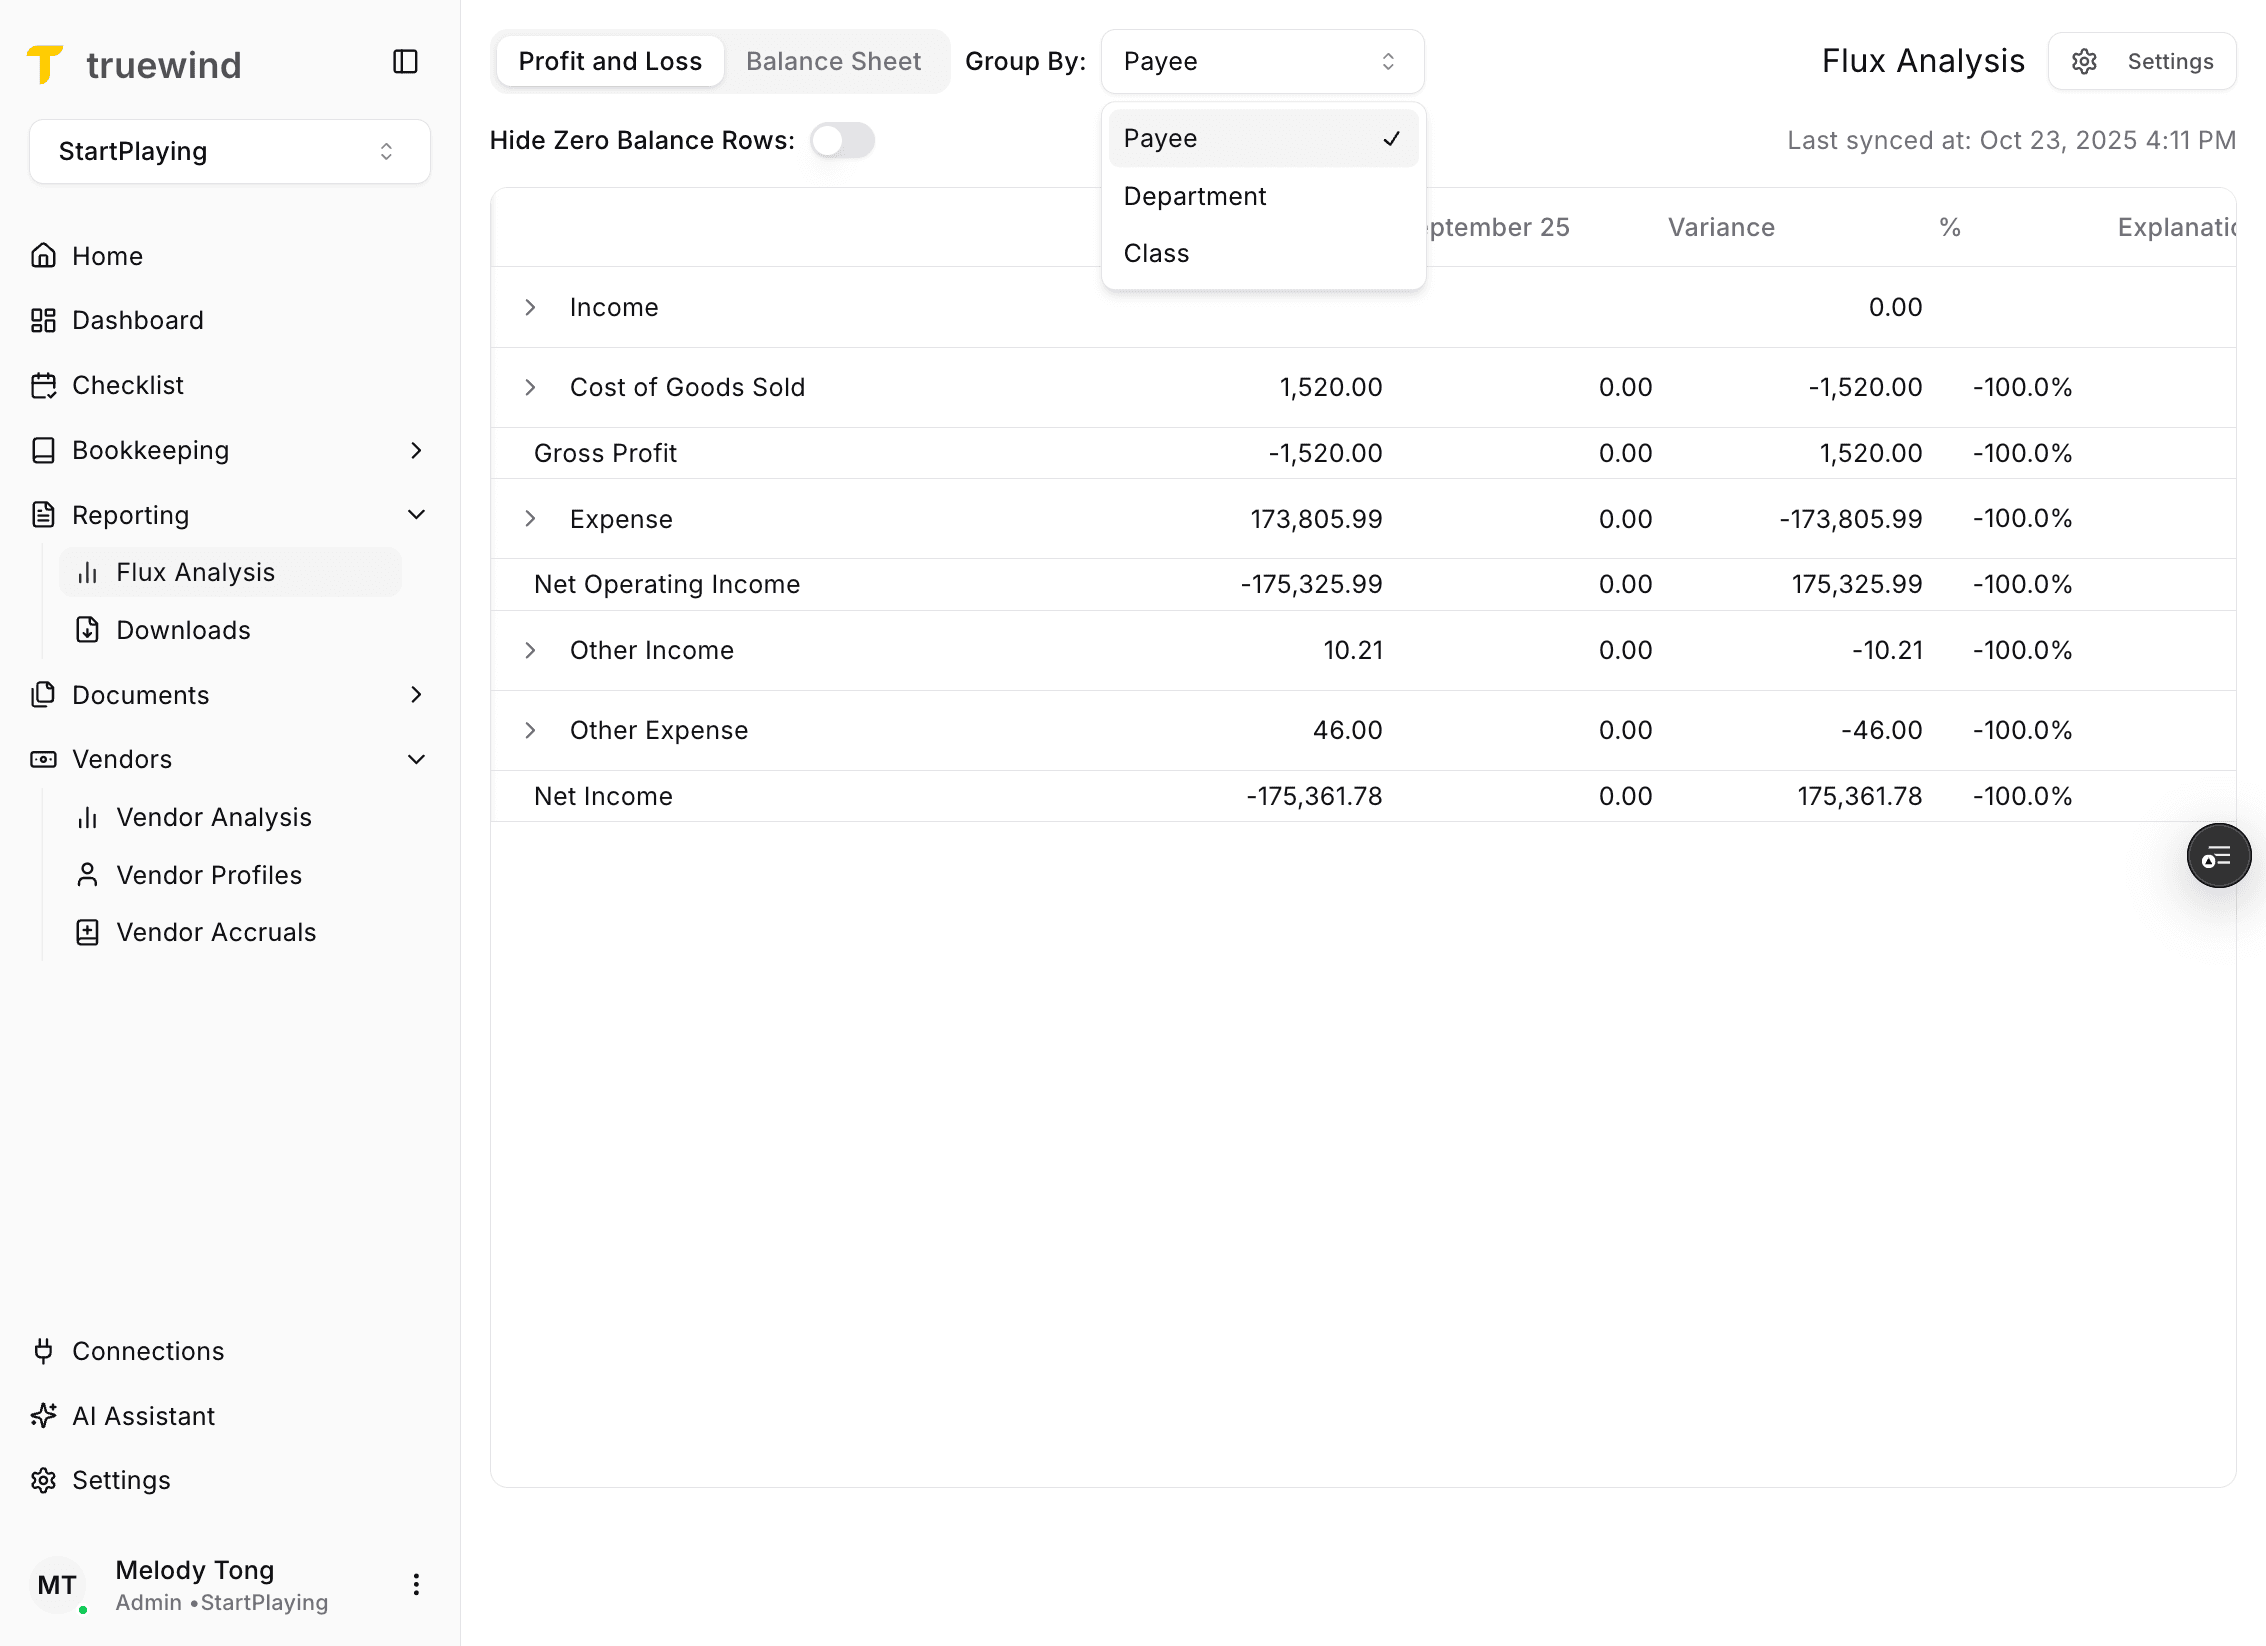
The default grouping is payee, but dimension-based grouping is available when those dimensions exist in the ERP data.
Step 5
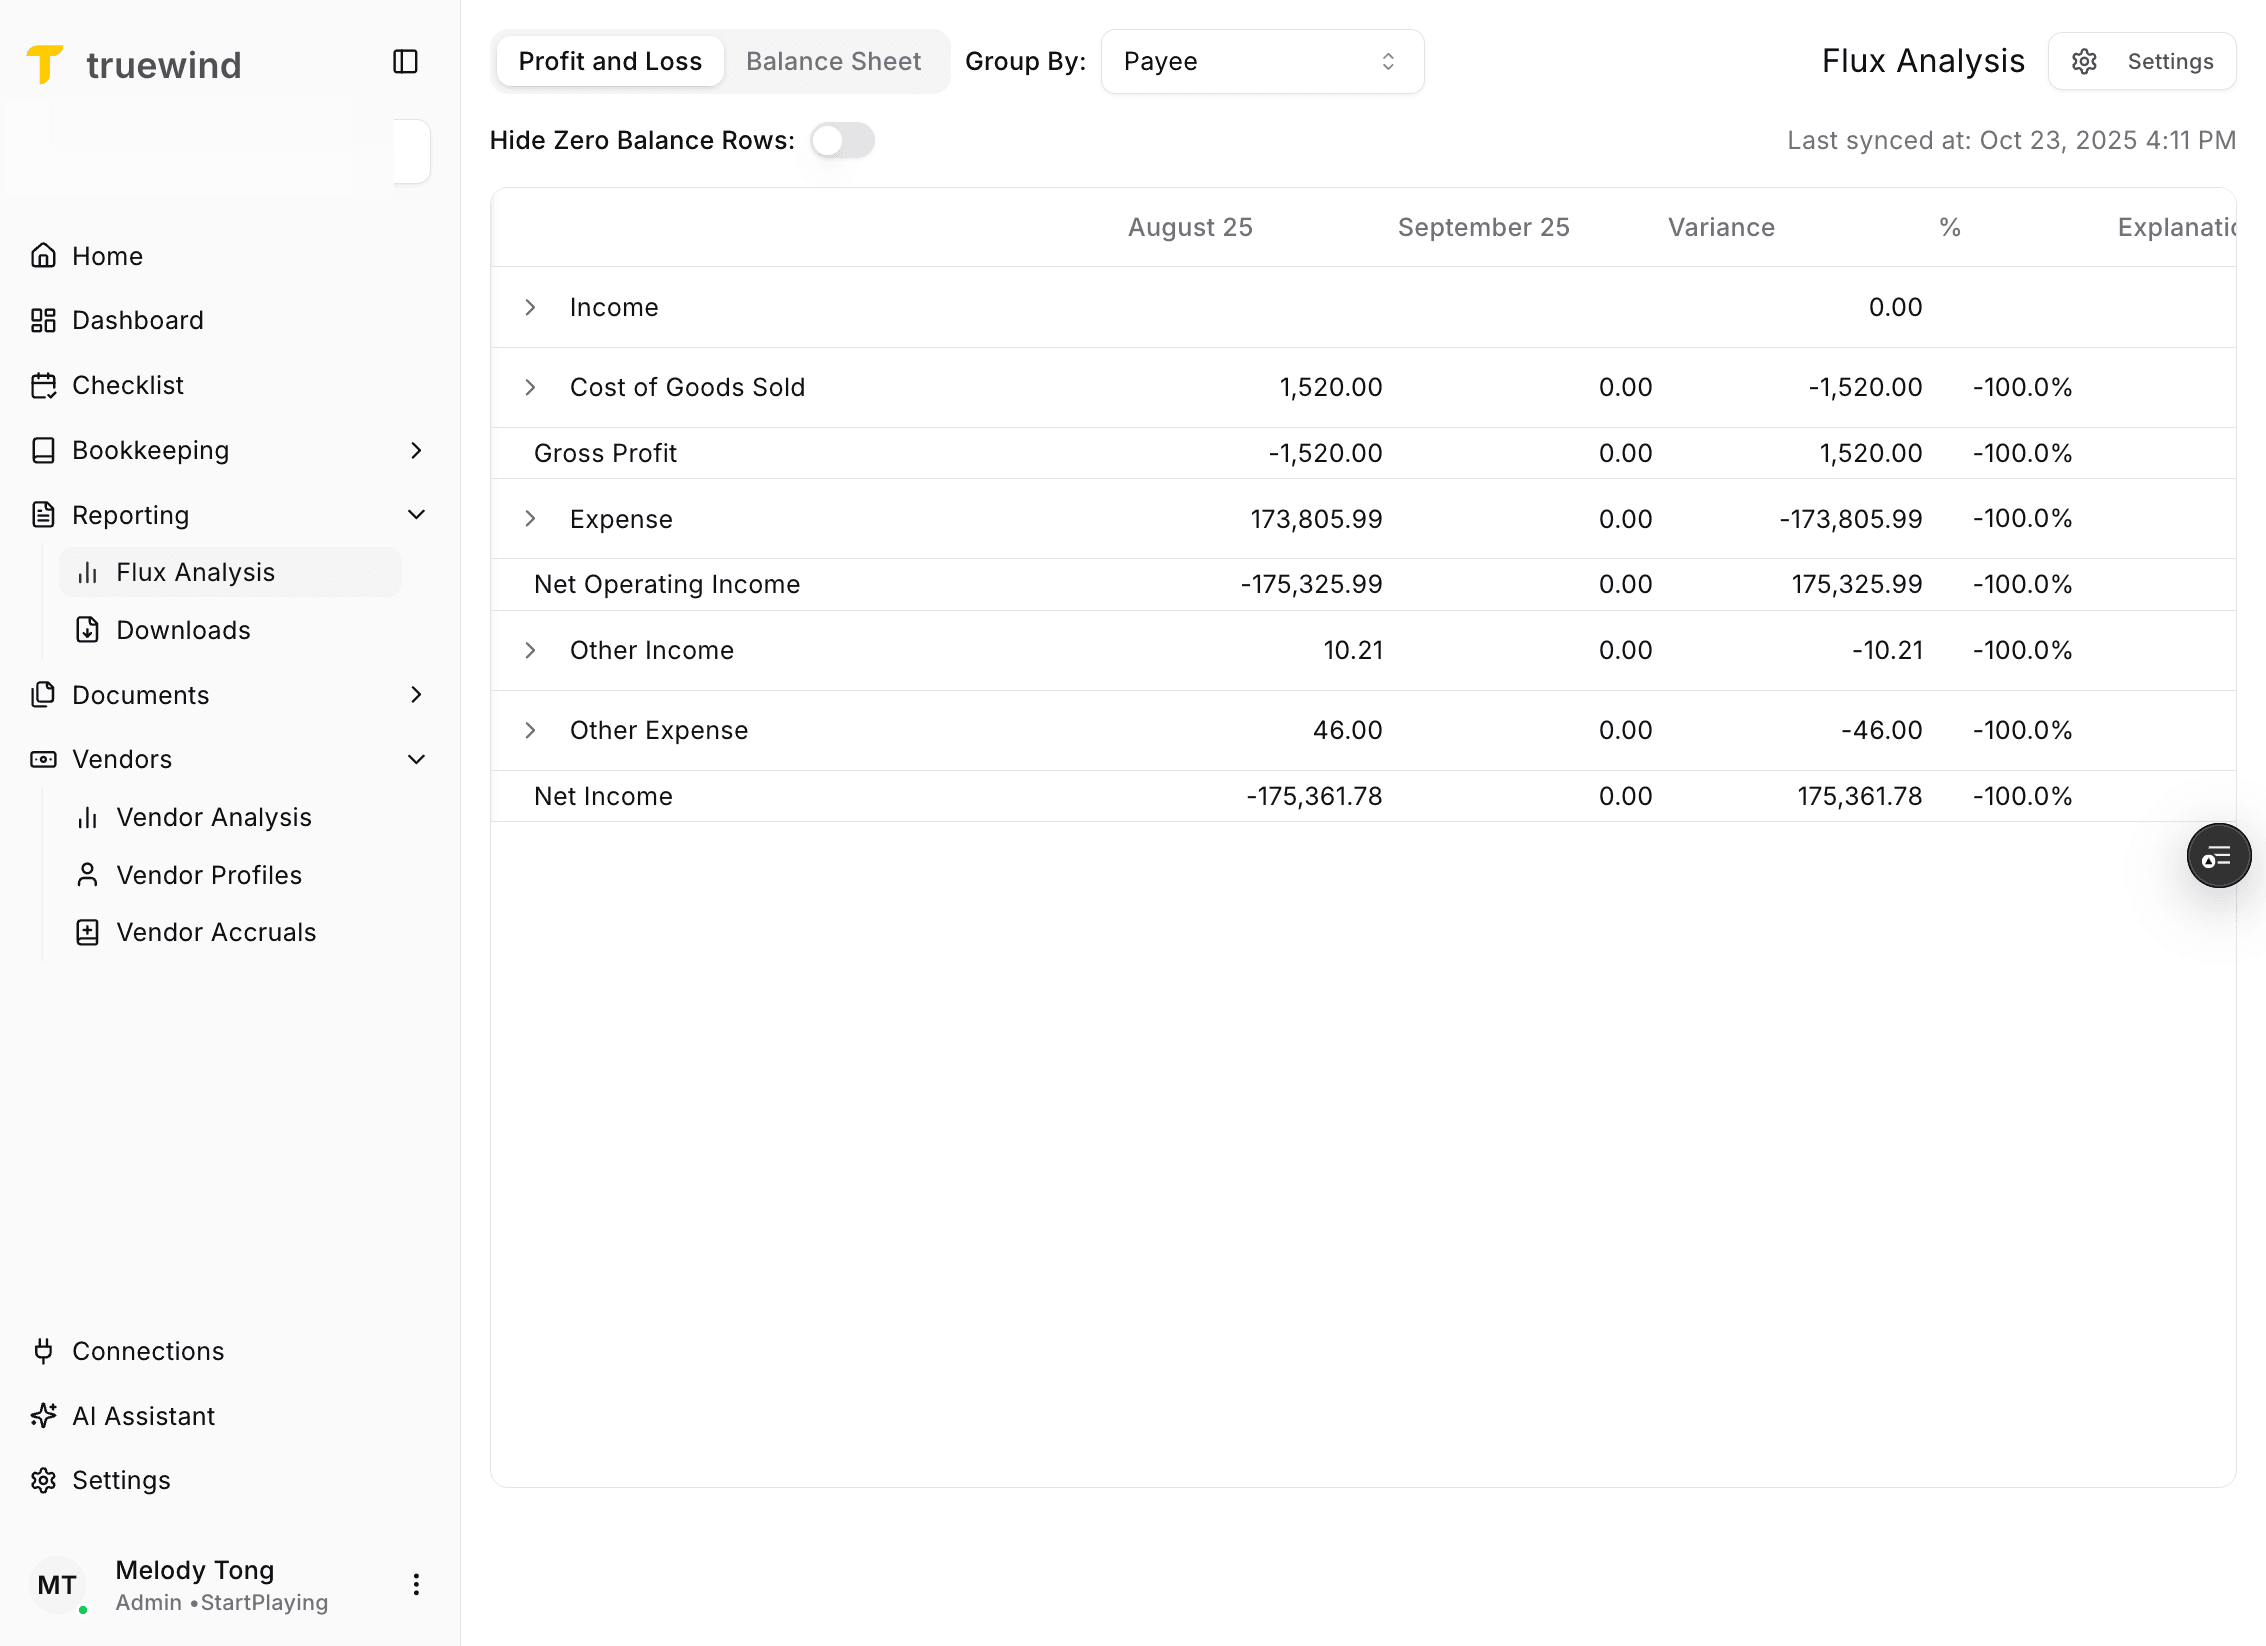
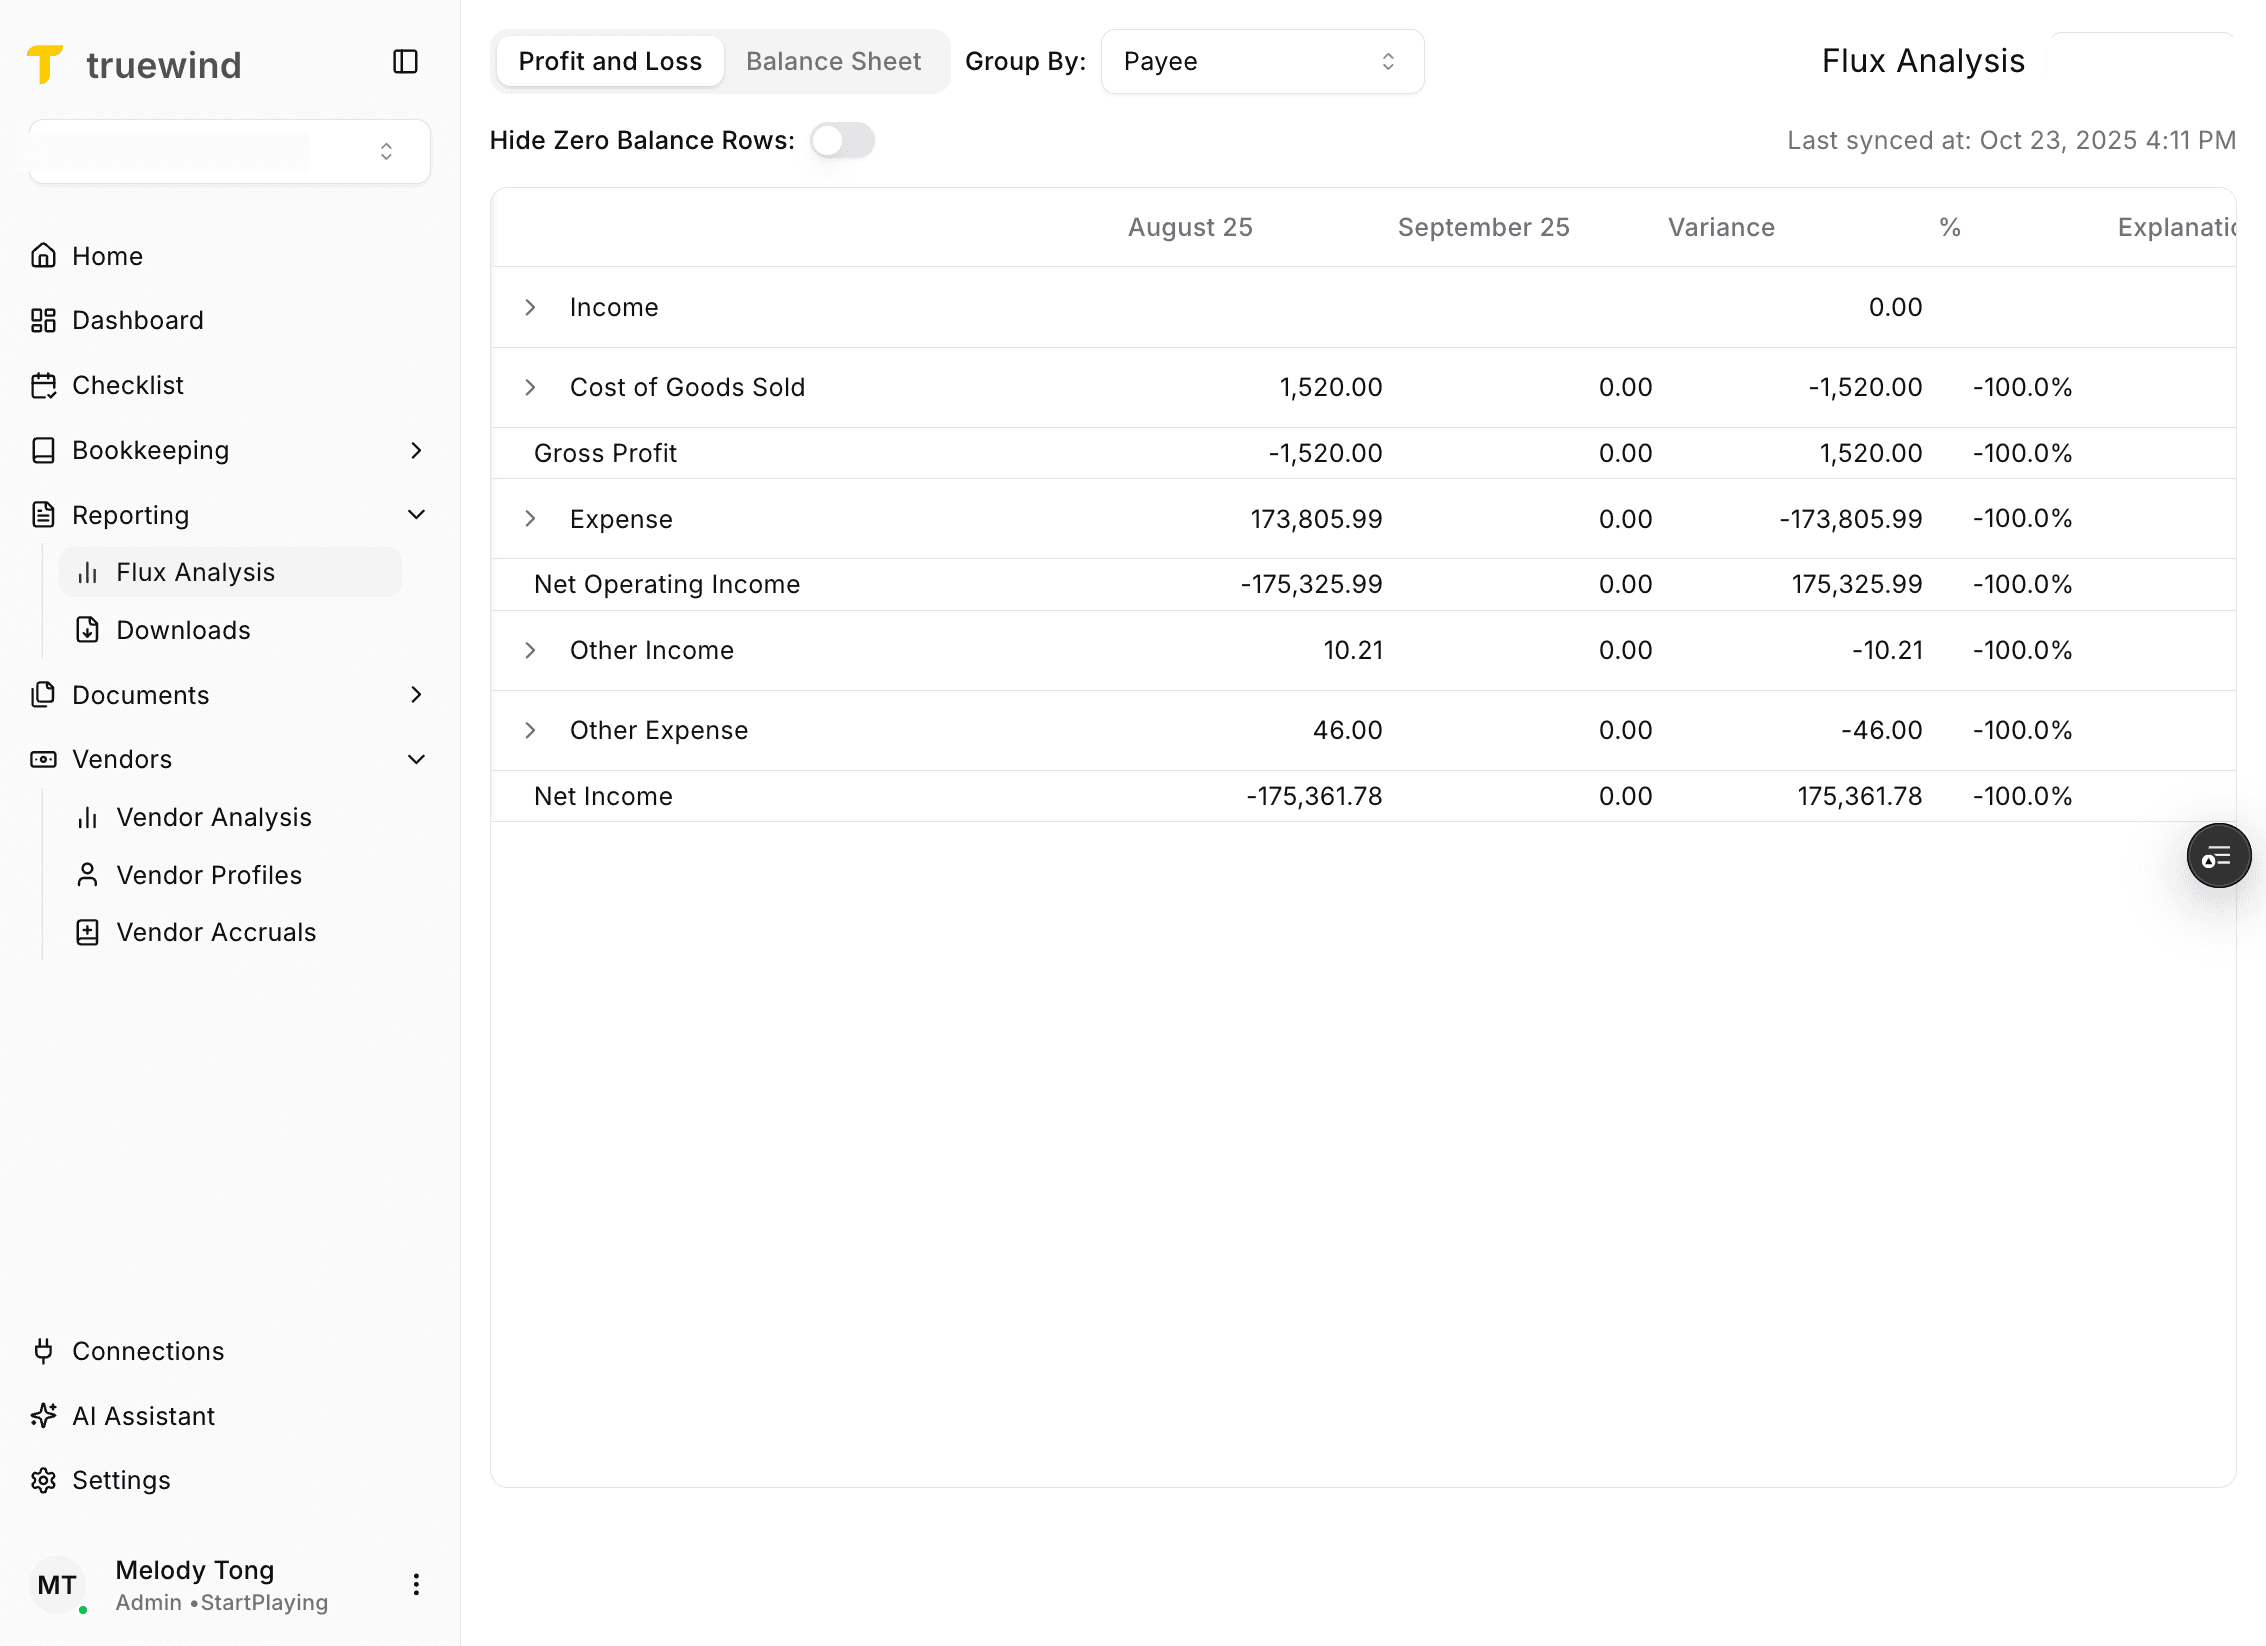
Use this when you want to remove zero-balance vendors from the table for the selected date range.
Step 6
Confirm the latest sync timestamp before reviewing variances so you know how current the analysis is.
Step 7
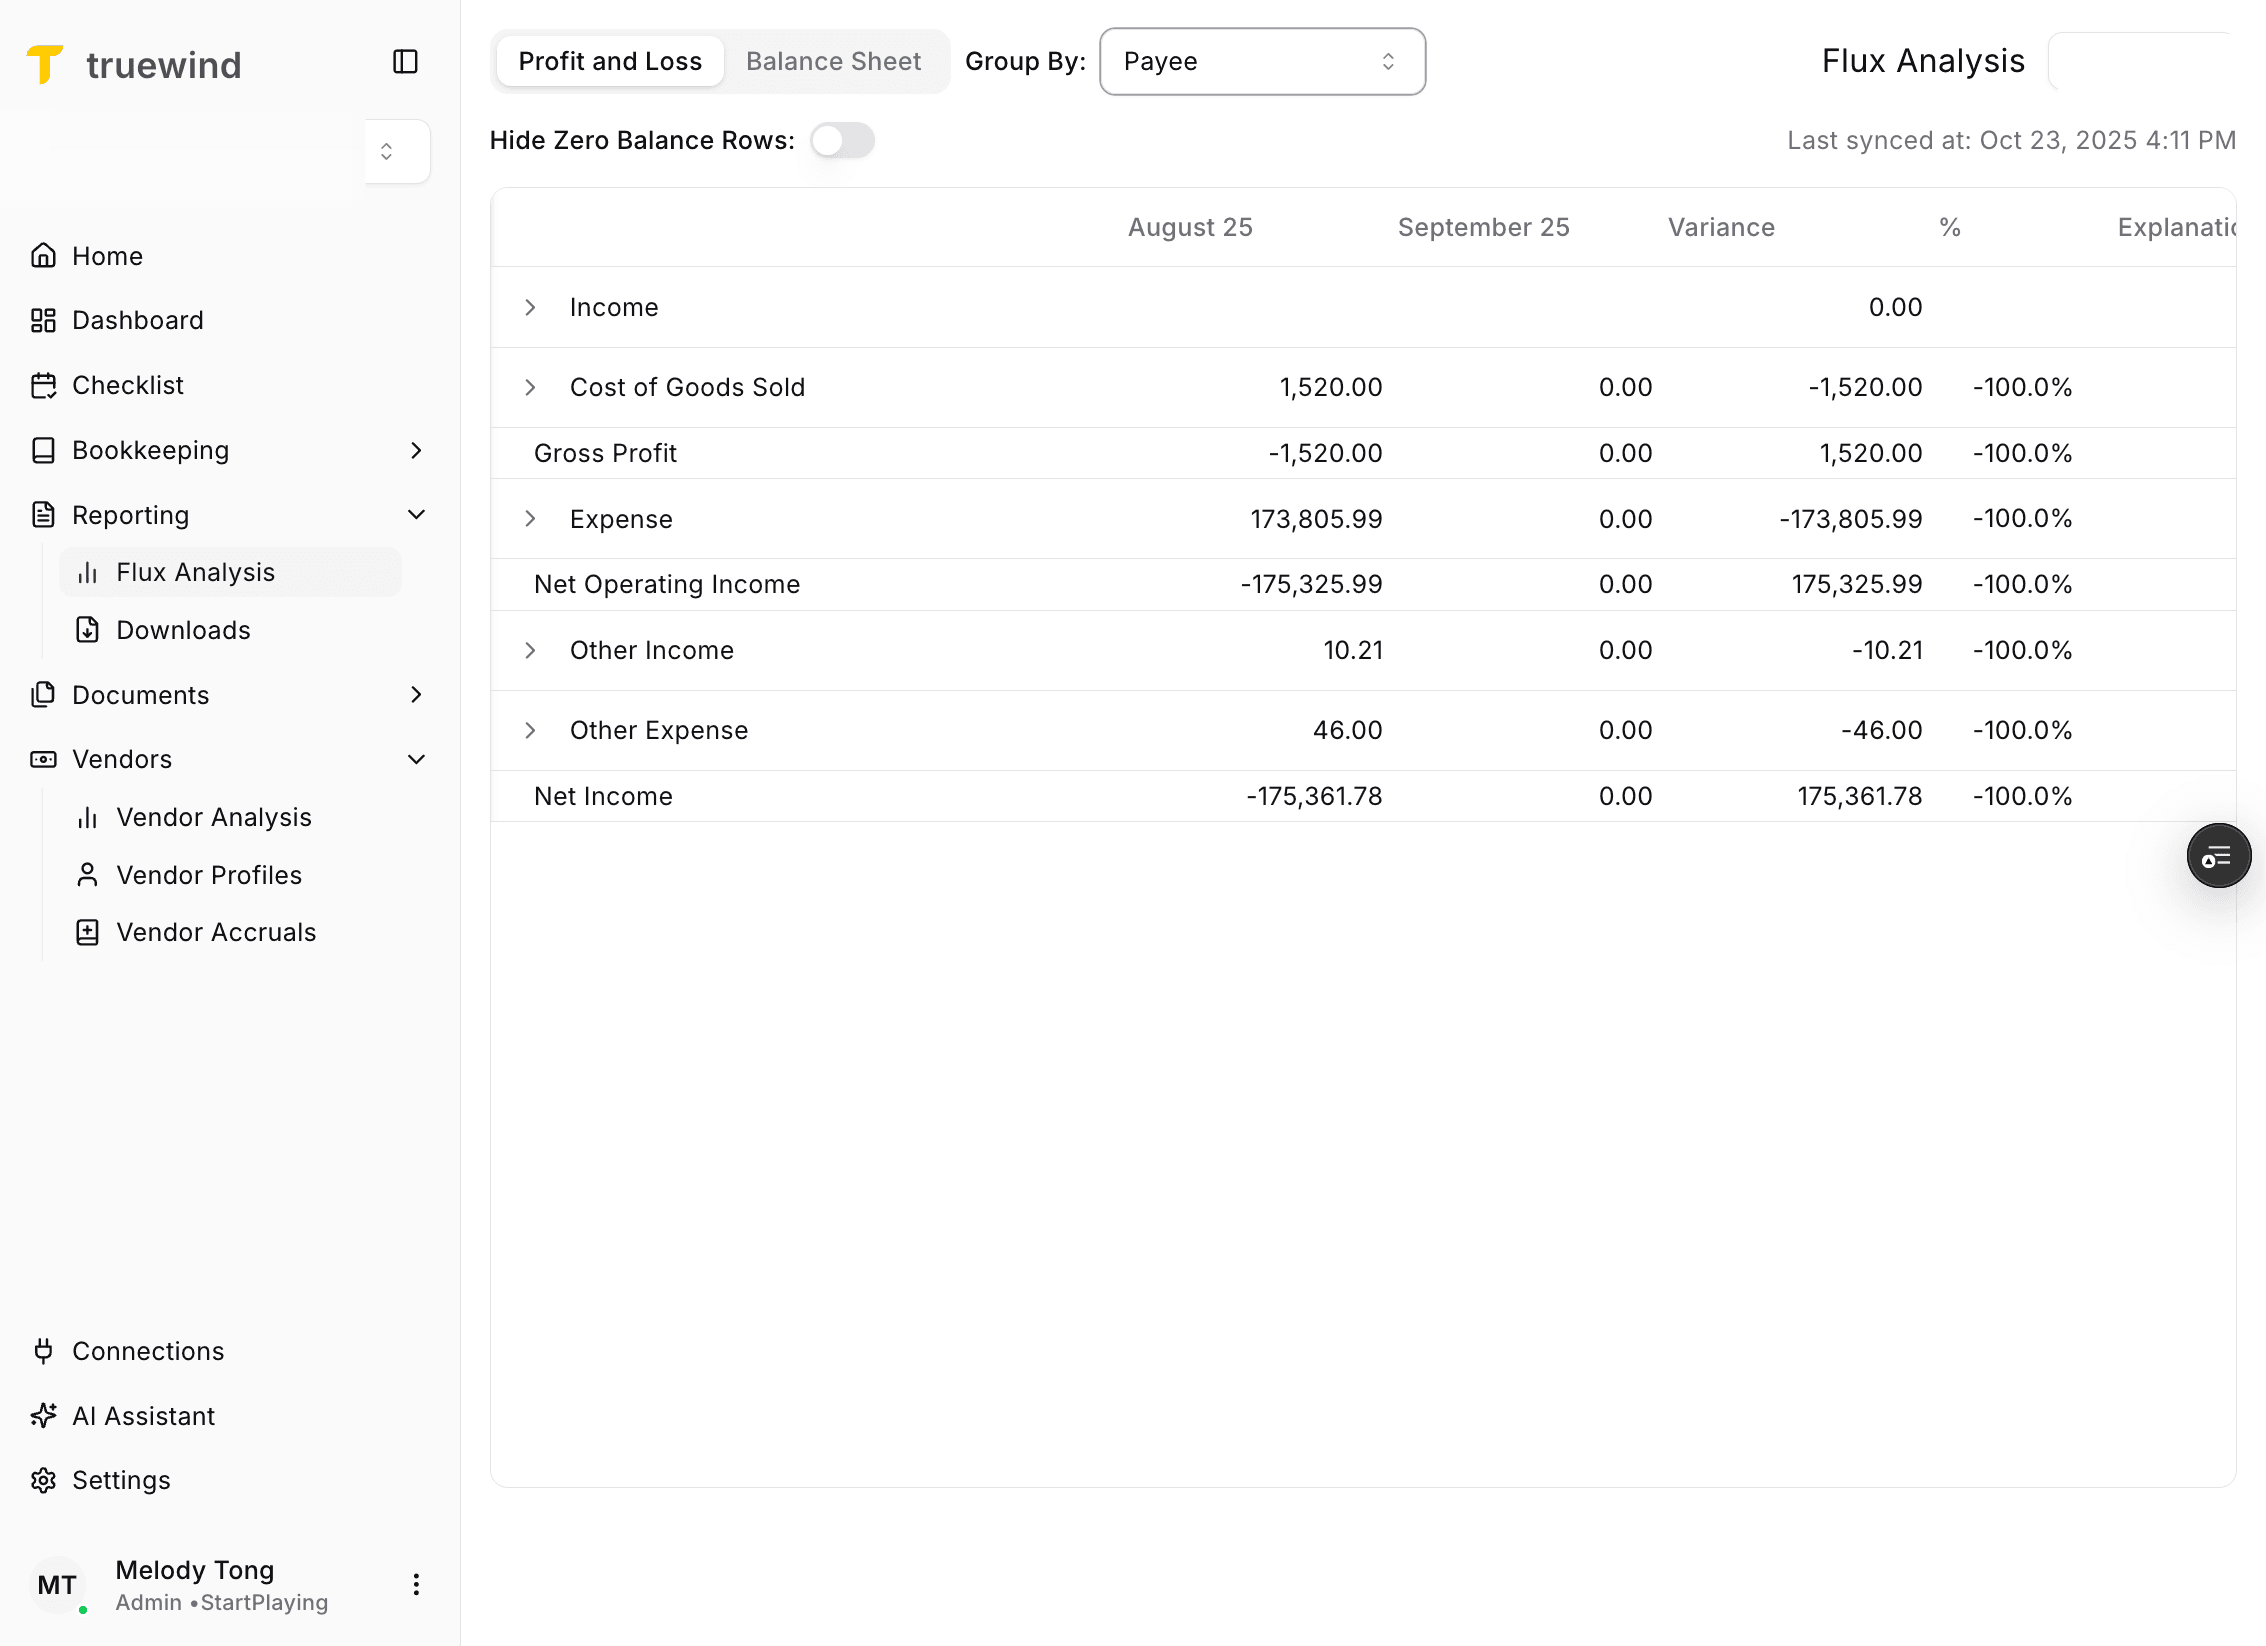
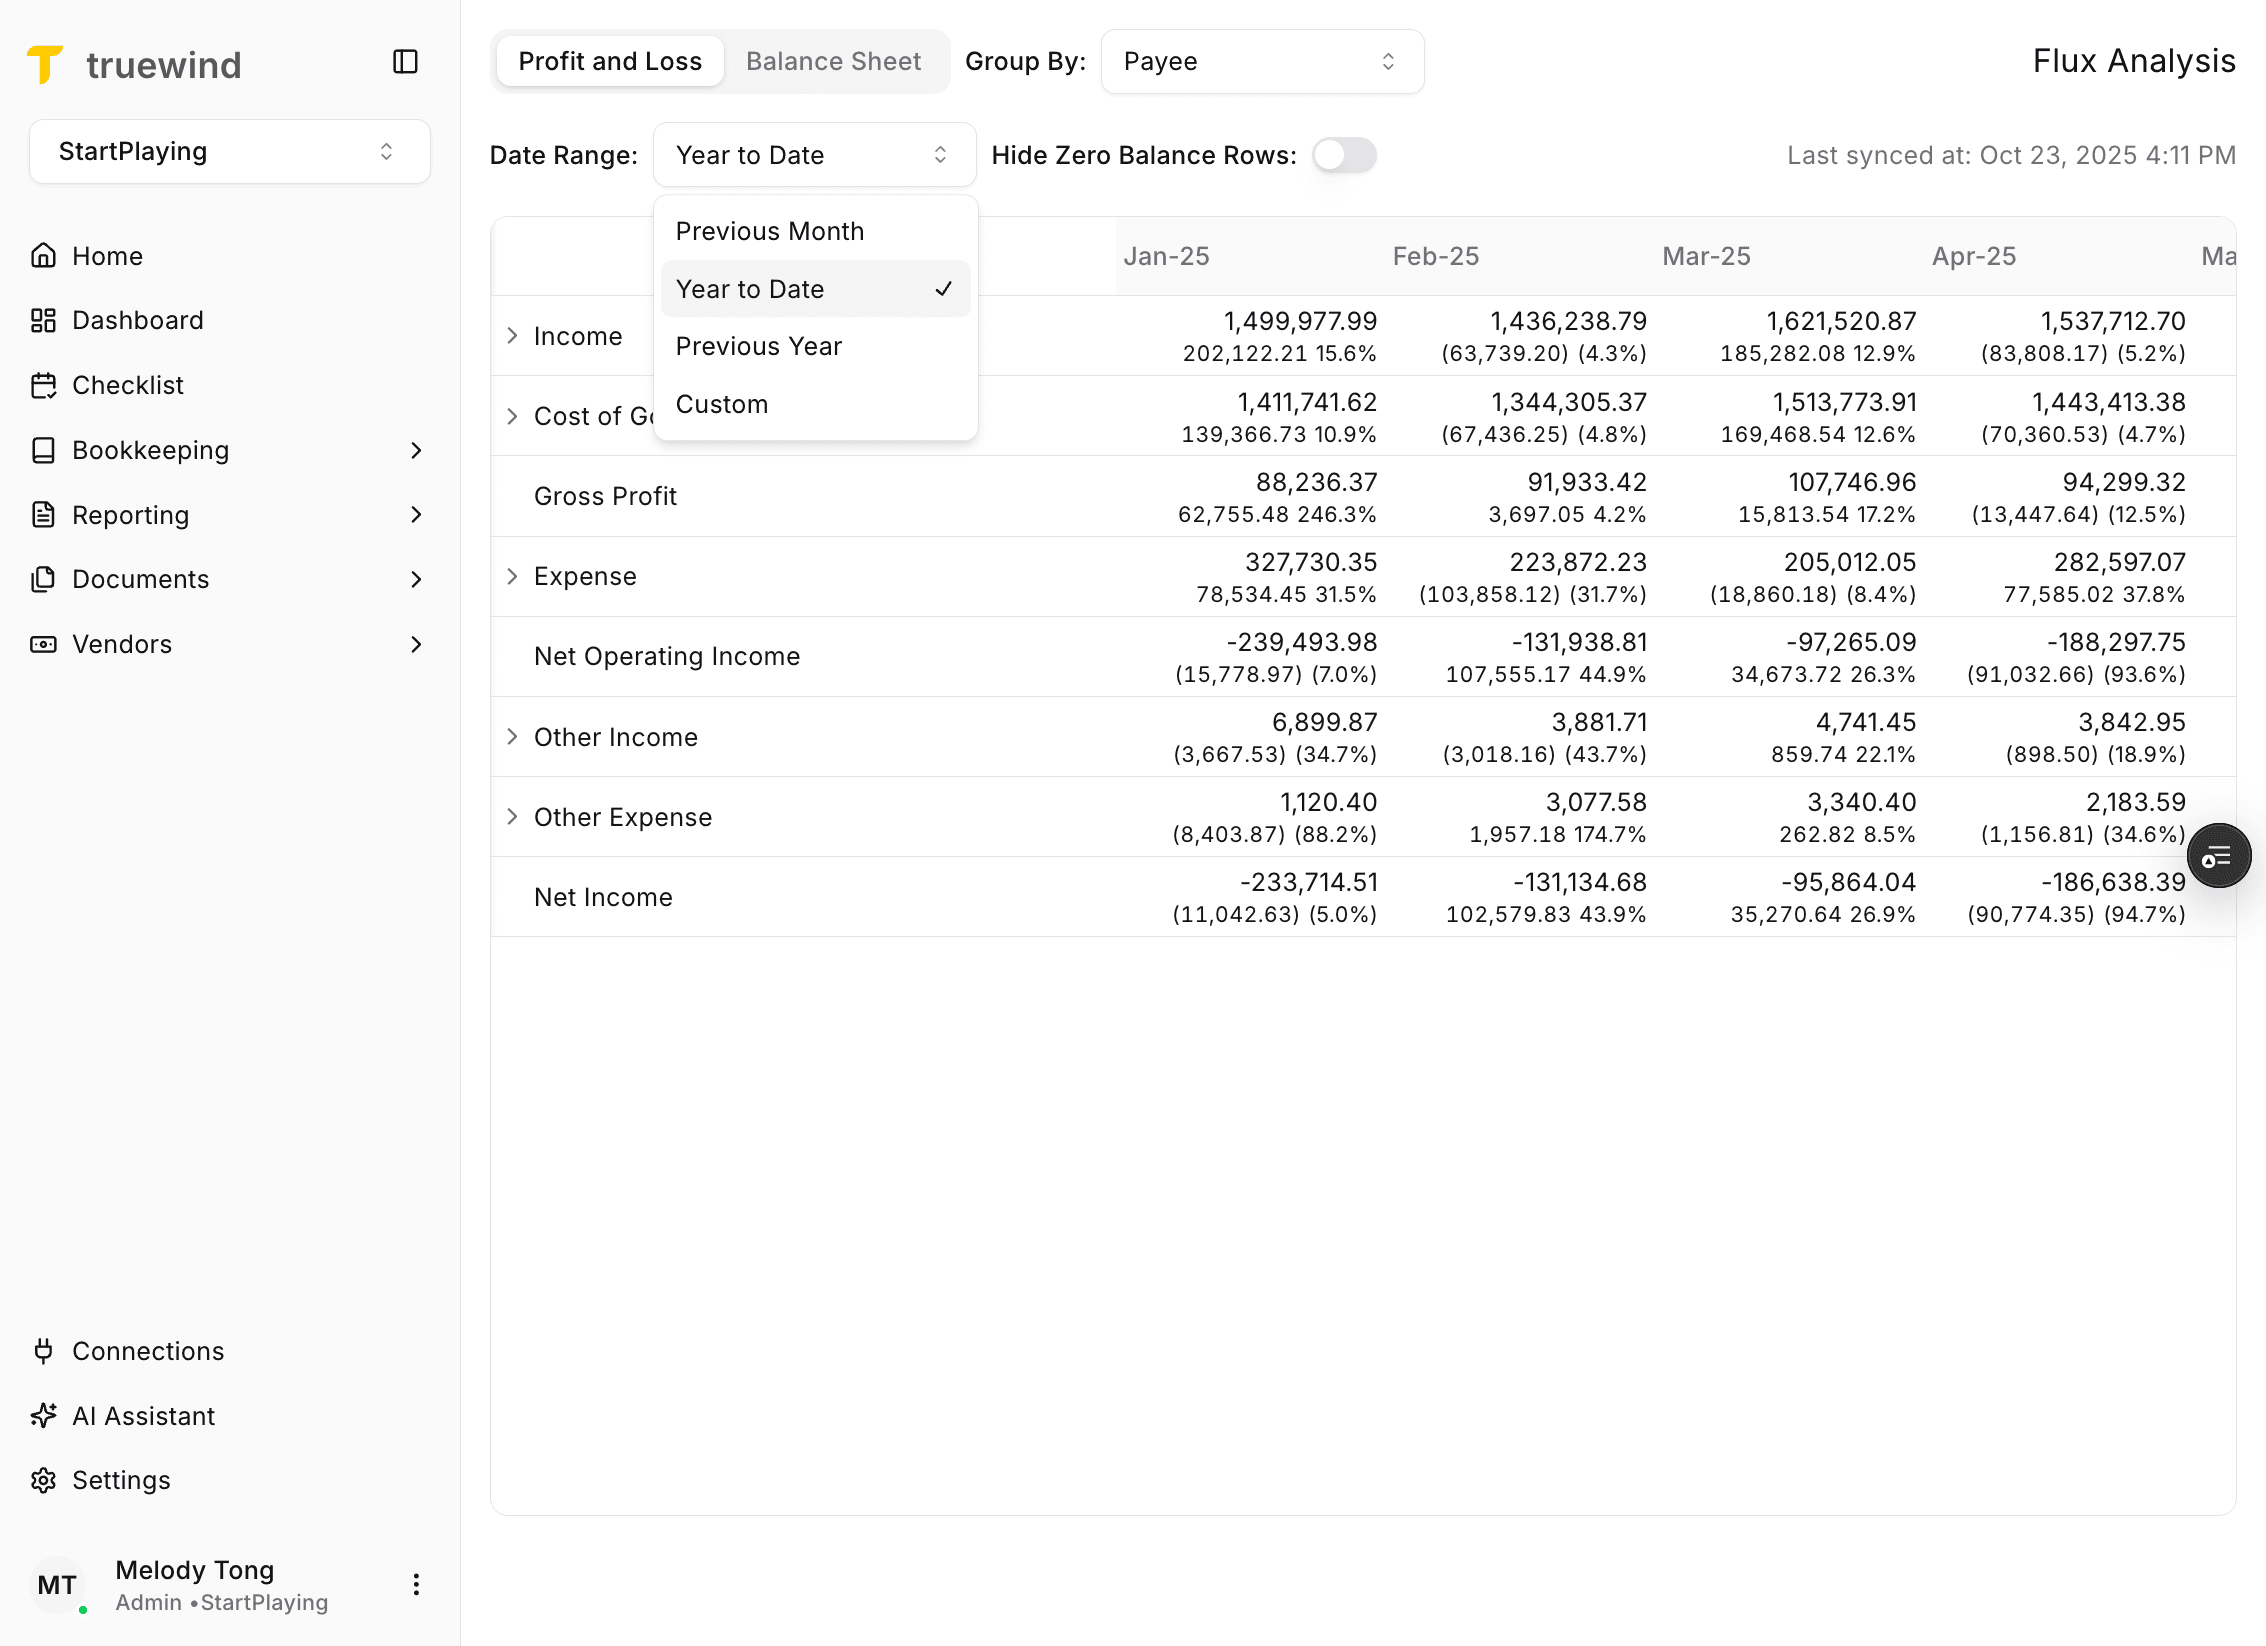
Pick the period you want to analyze before expanding any rows, because the selected range controls every variance in the table.
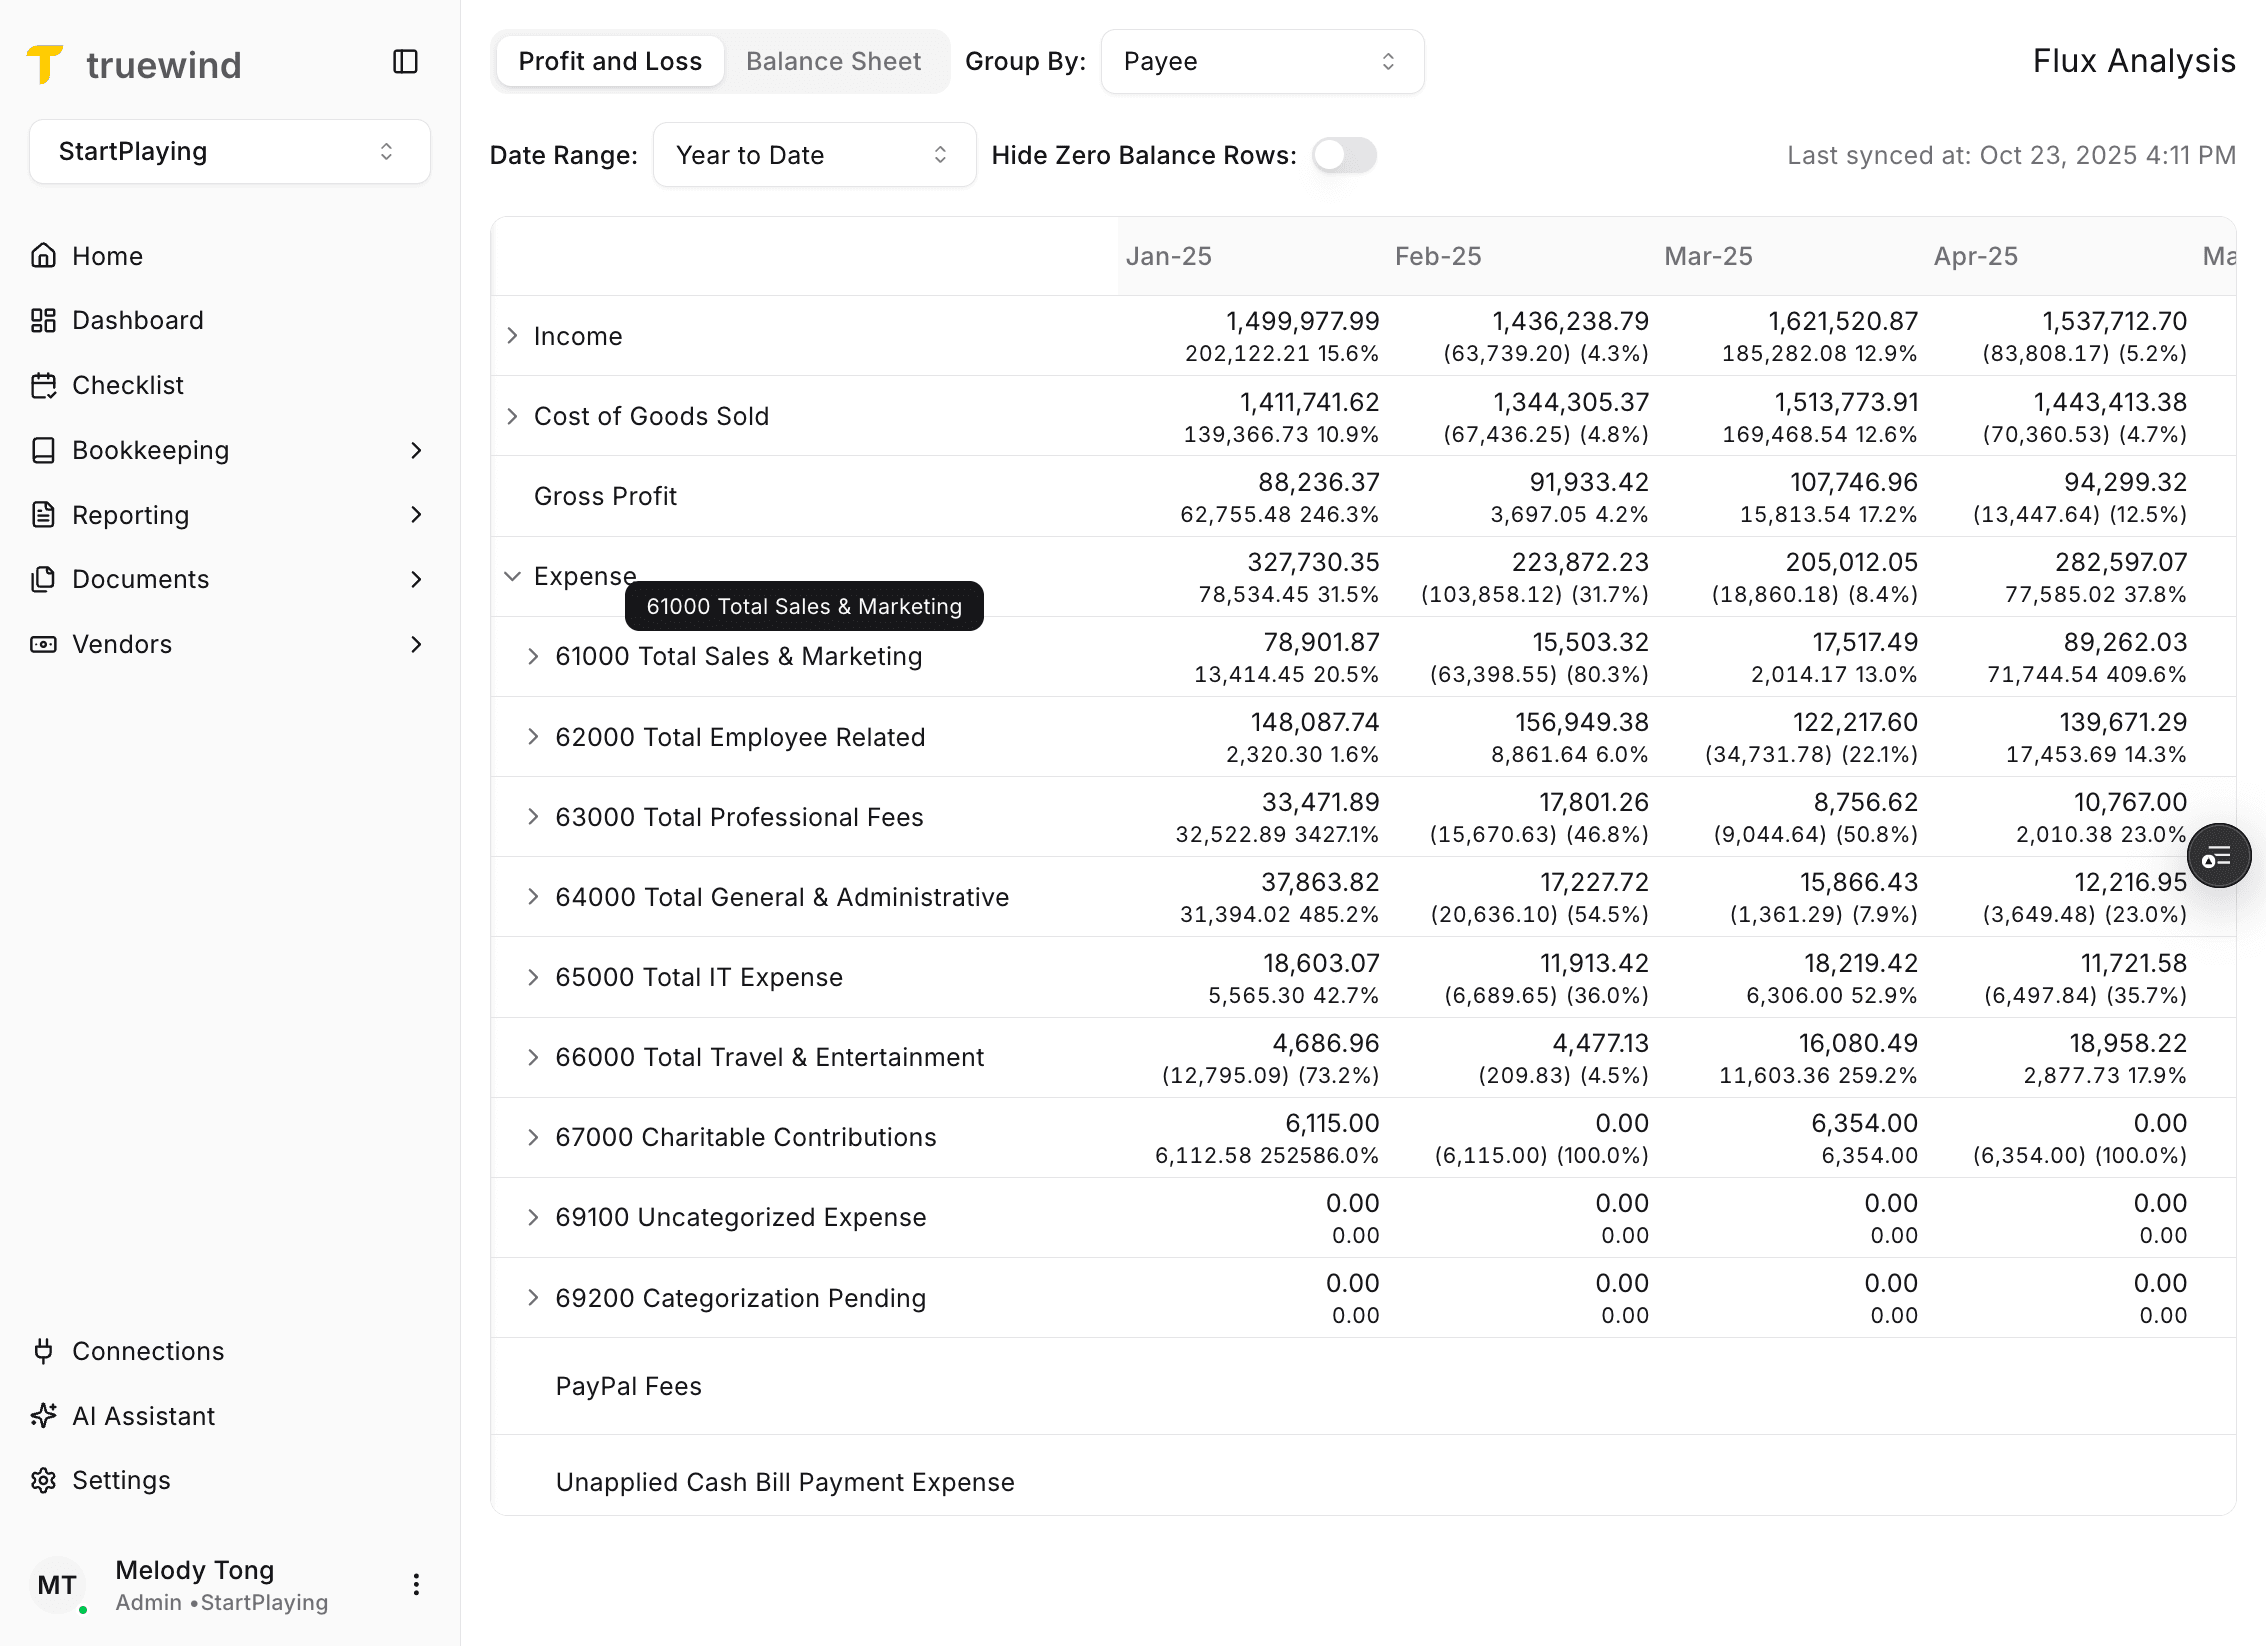
Step 8
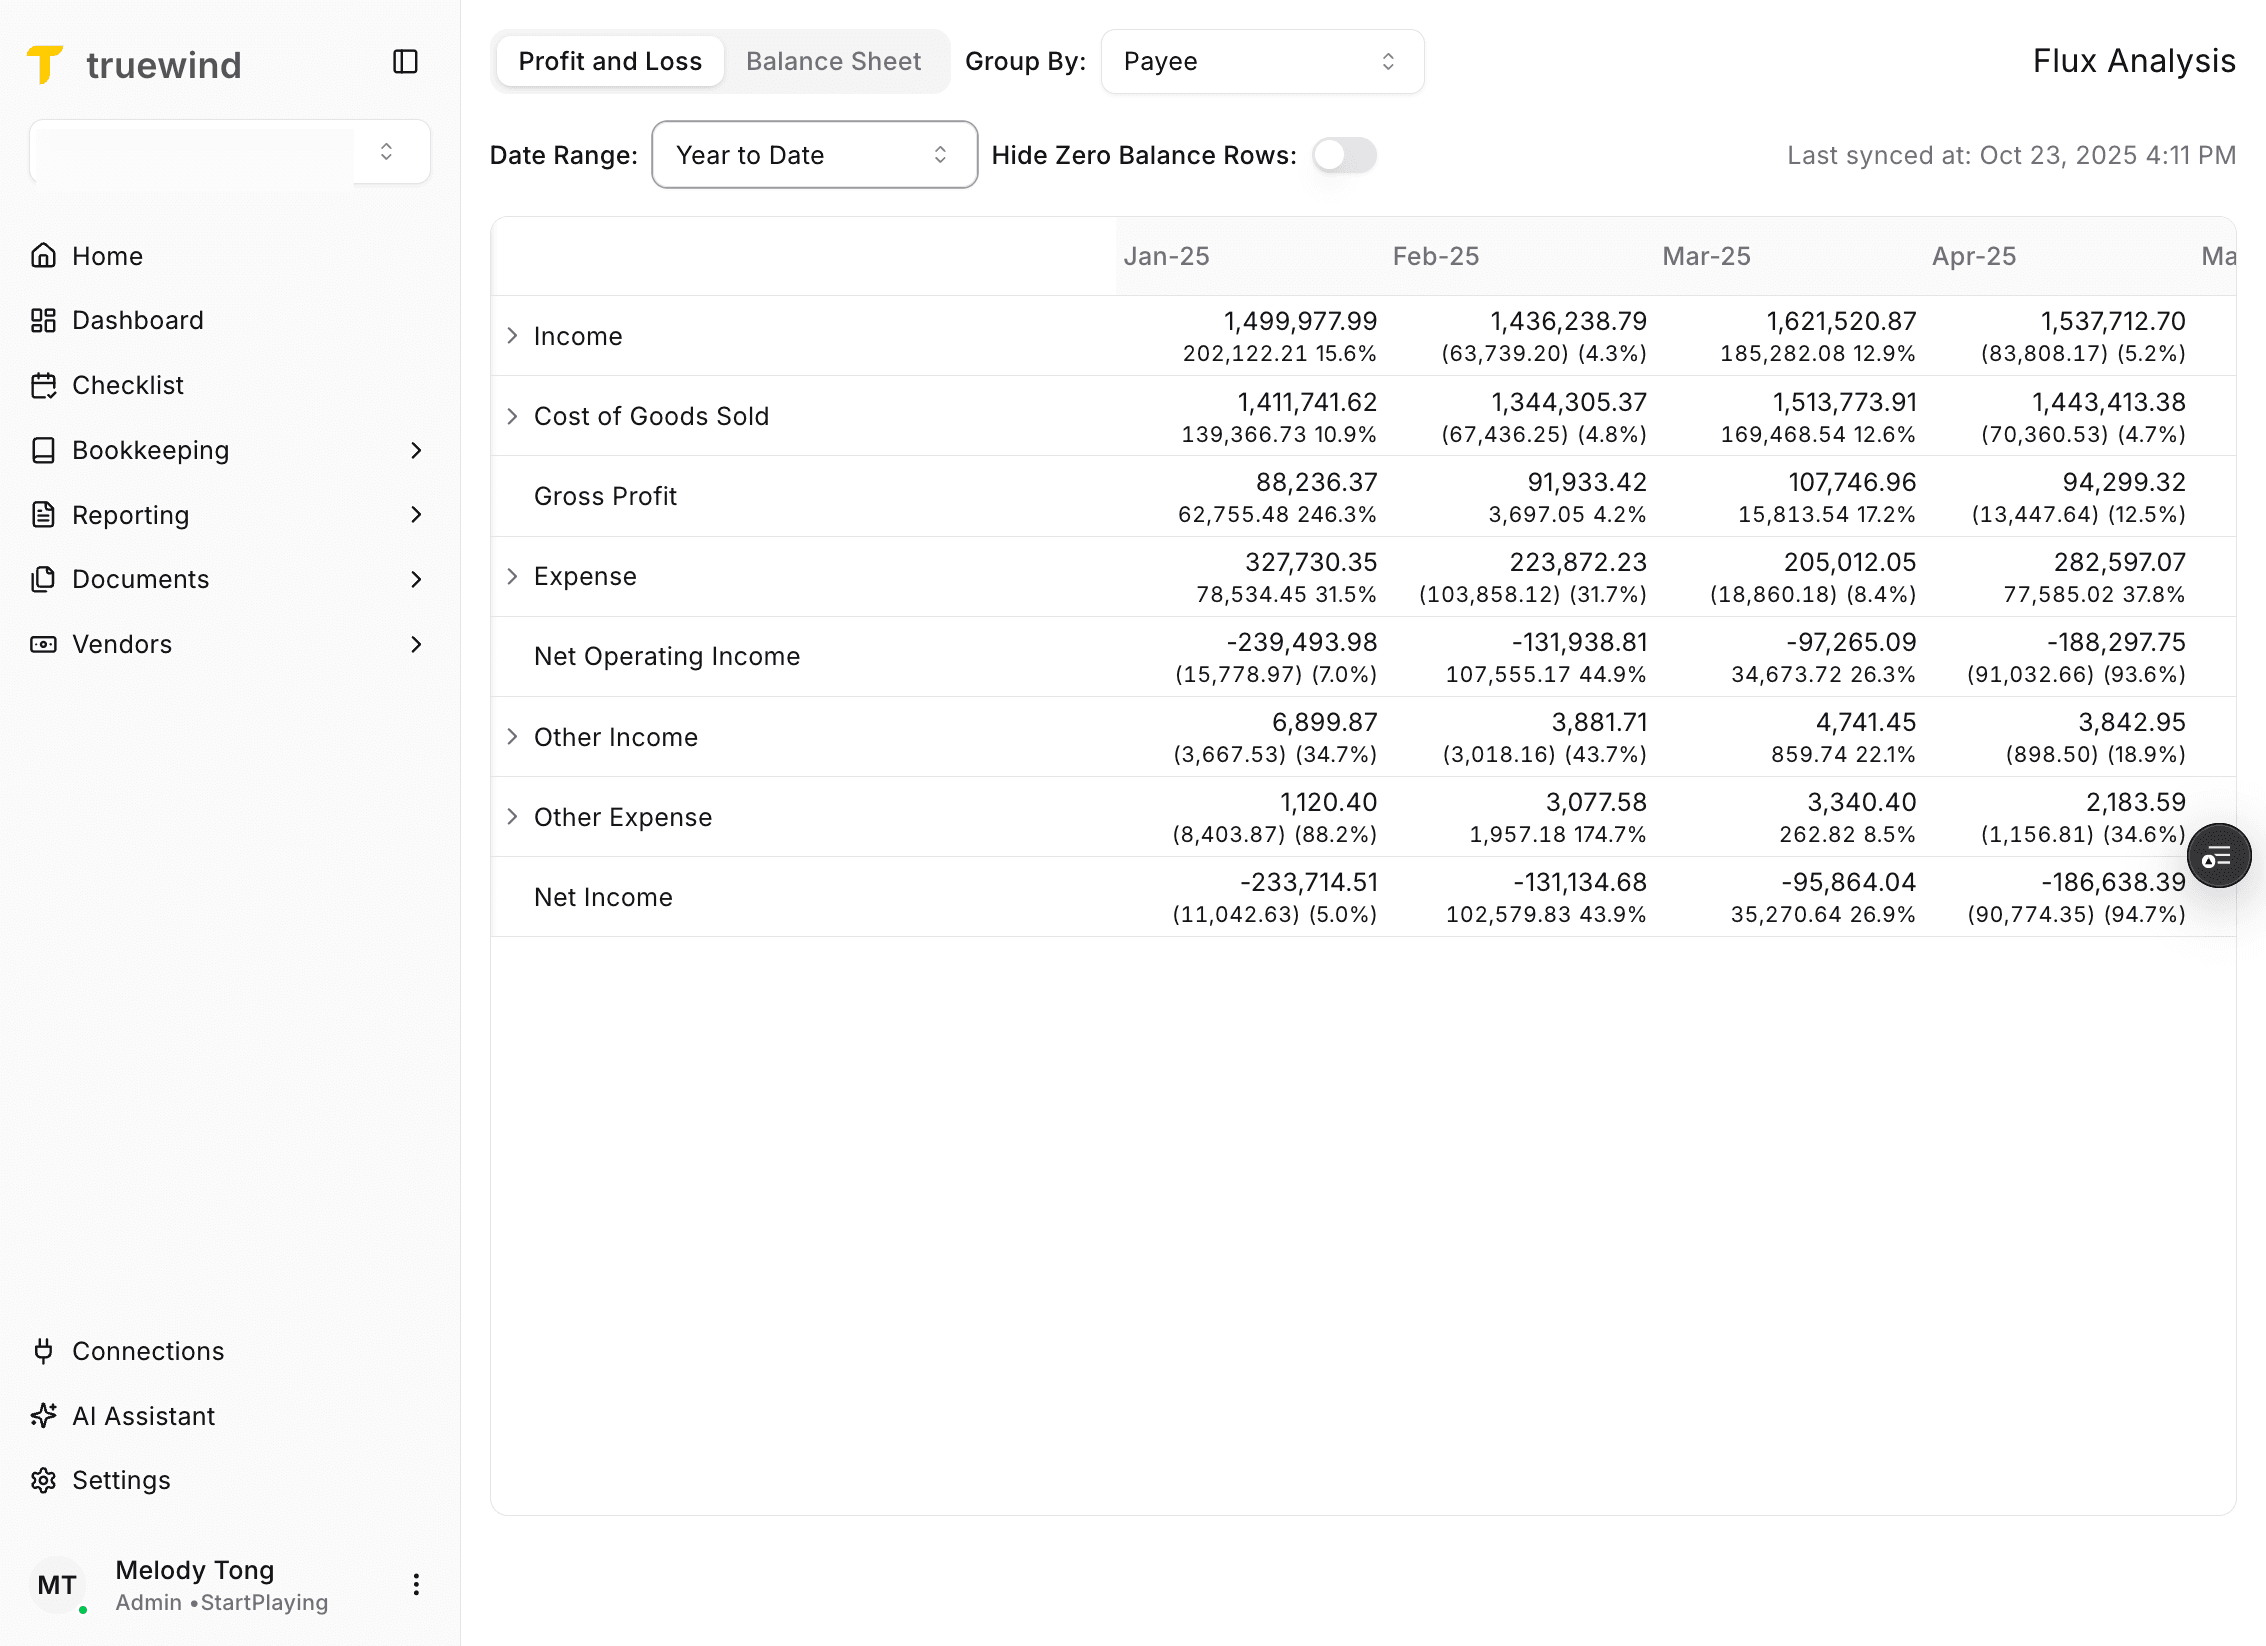
The default table shows the parent account level first so you can start high-level and then drill down where needed.
Step 9
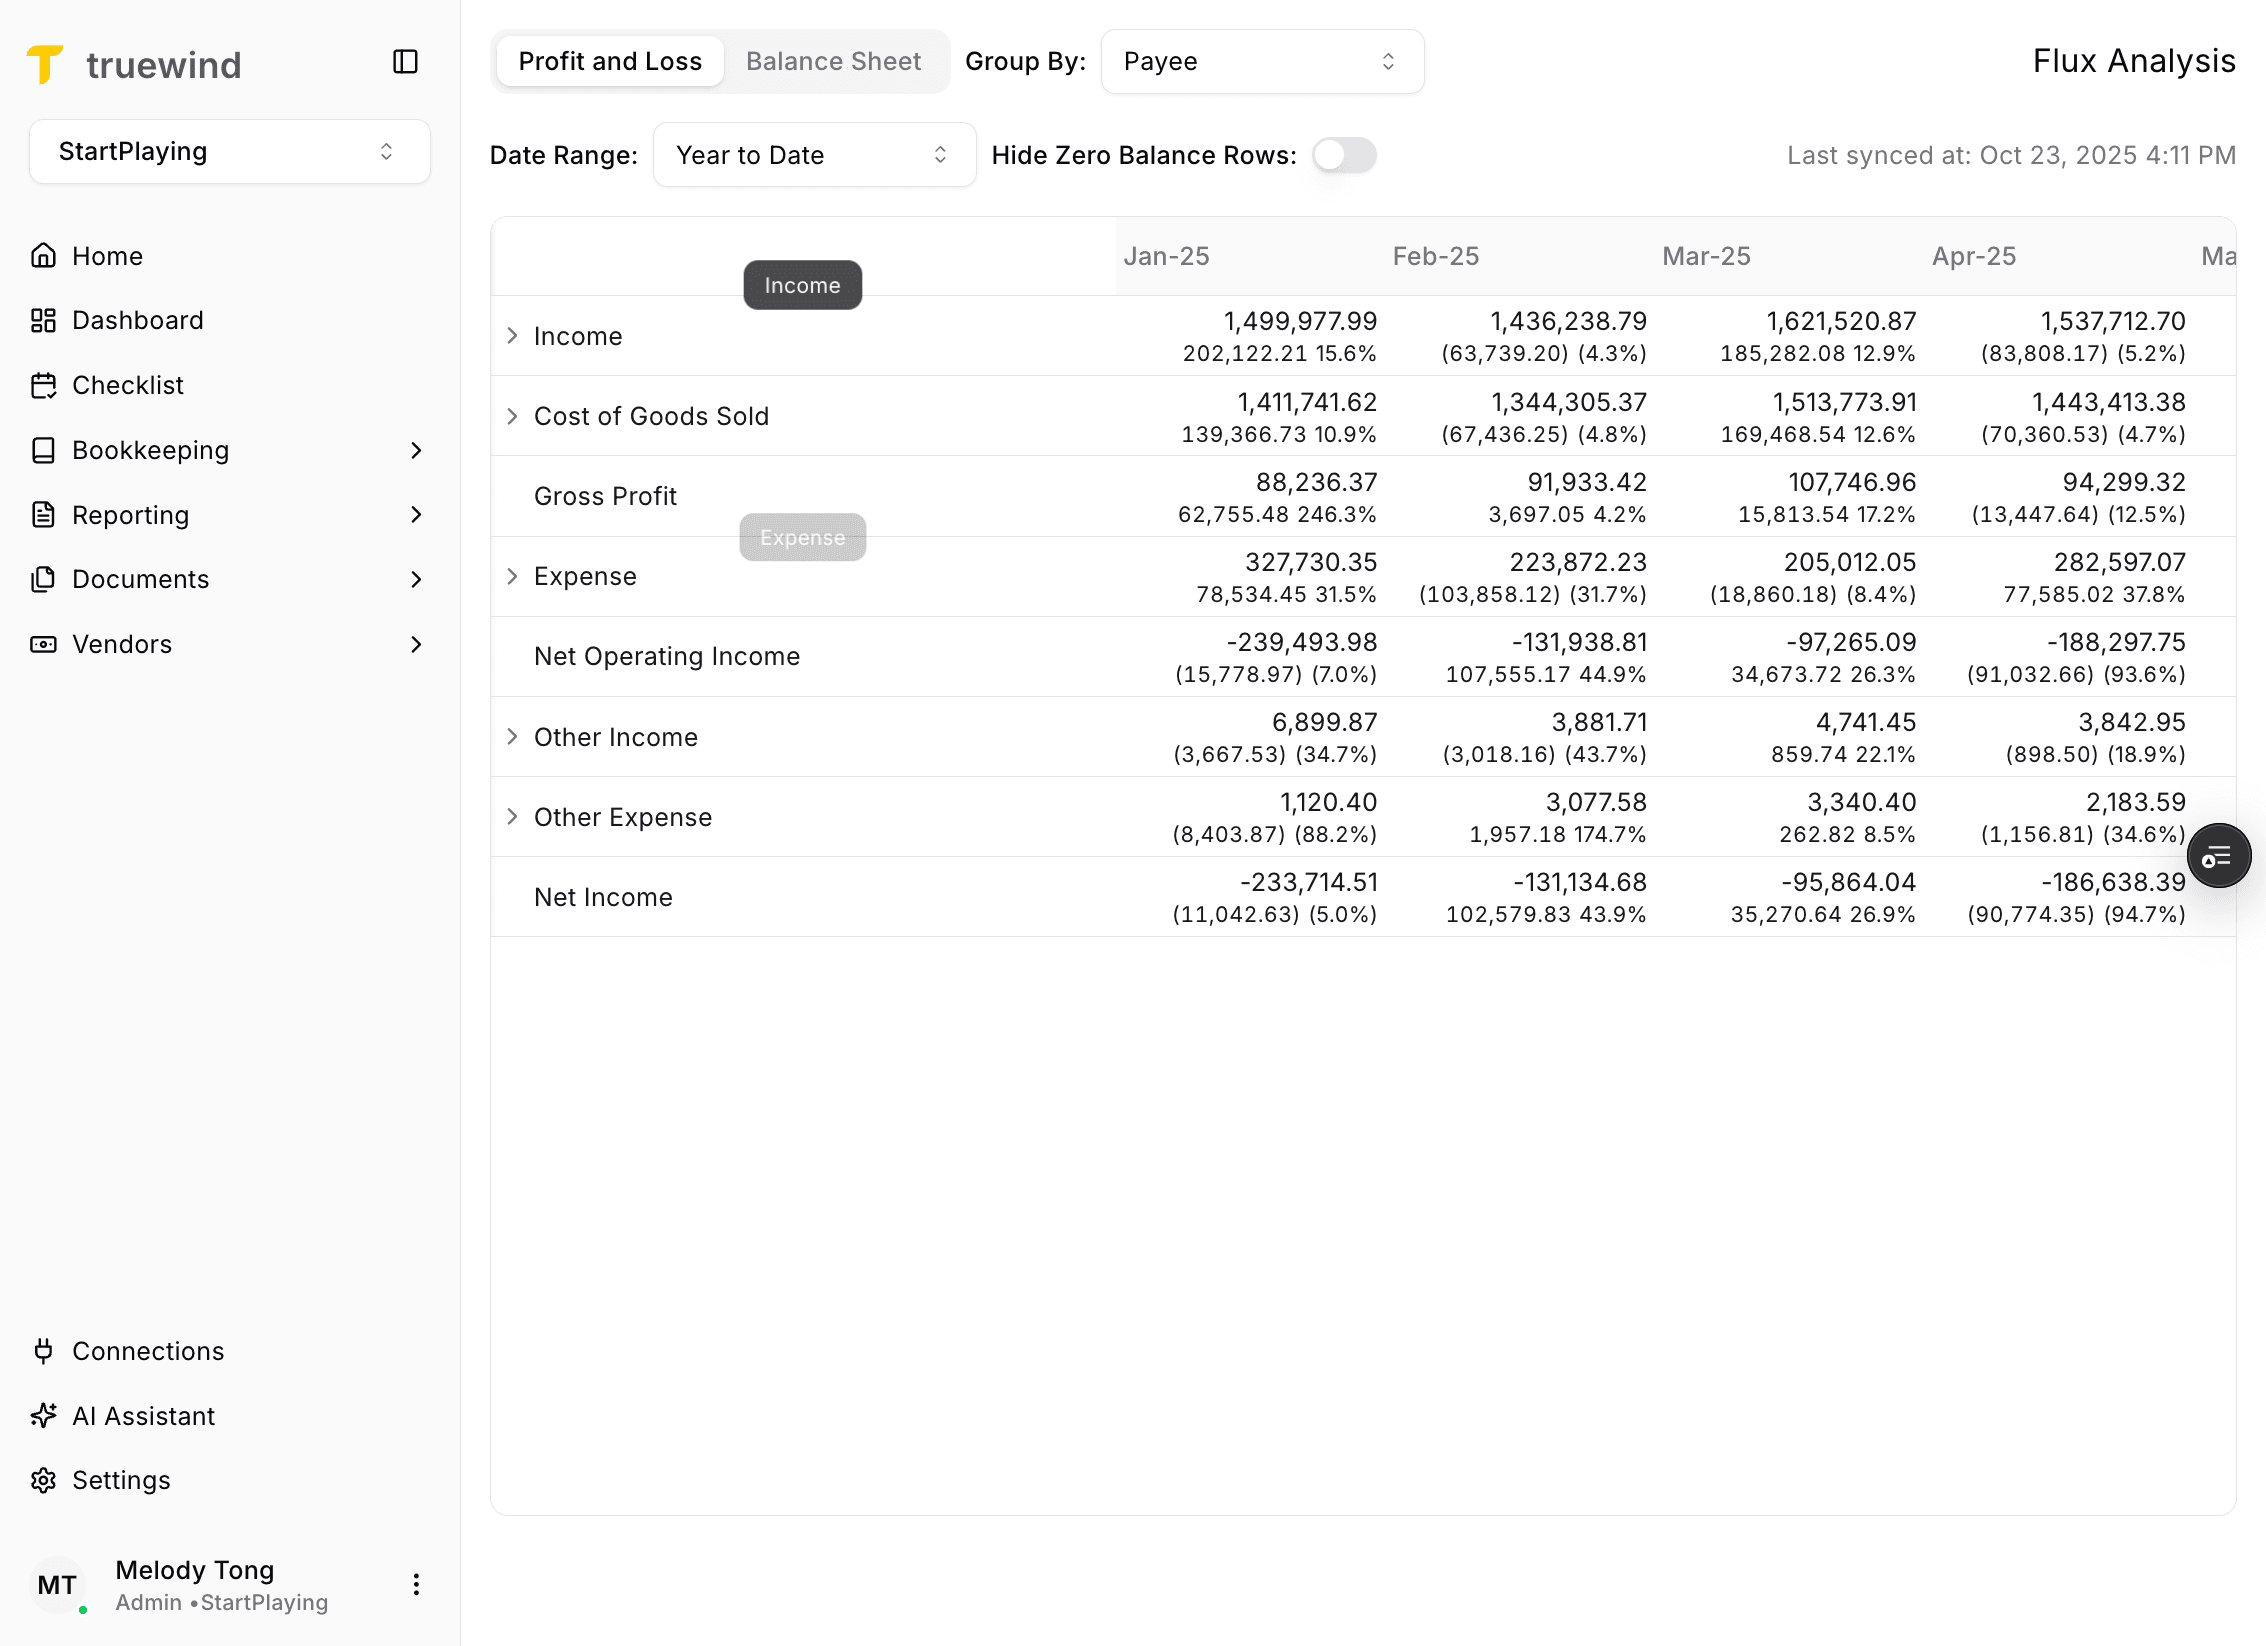
Expand the row to move from the parent account into the next level of detail.
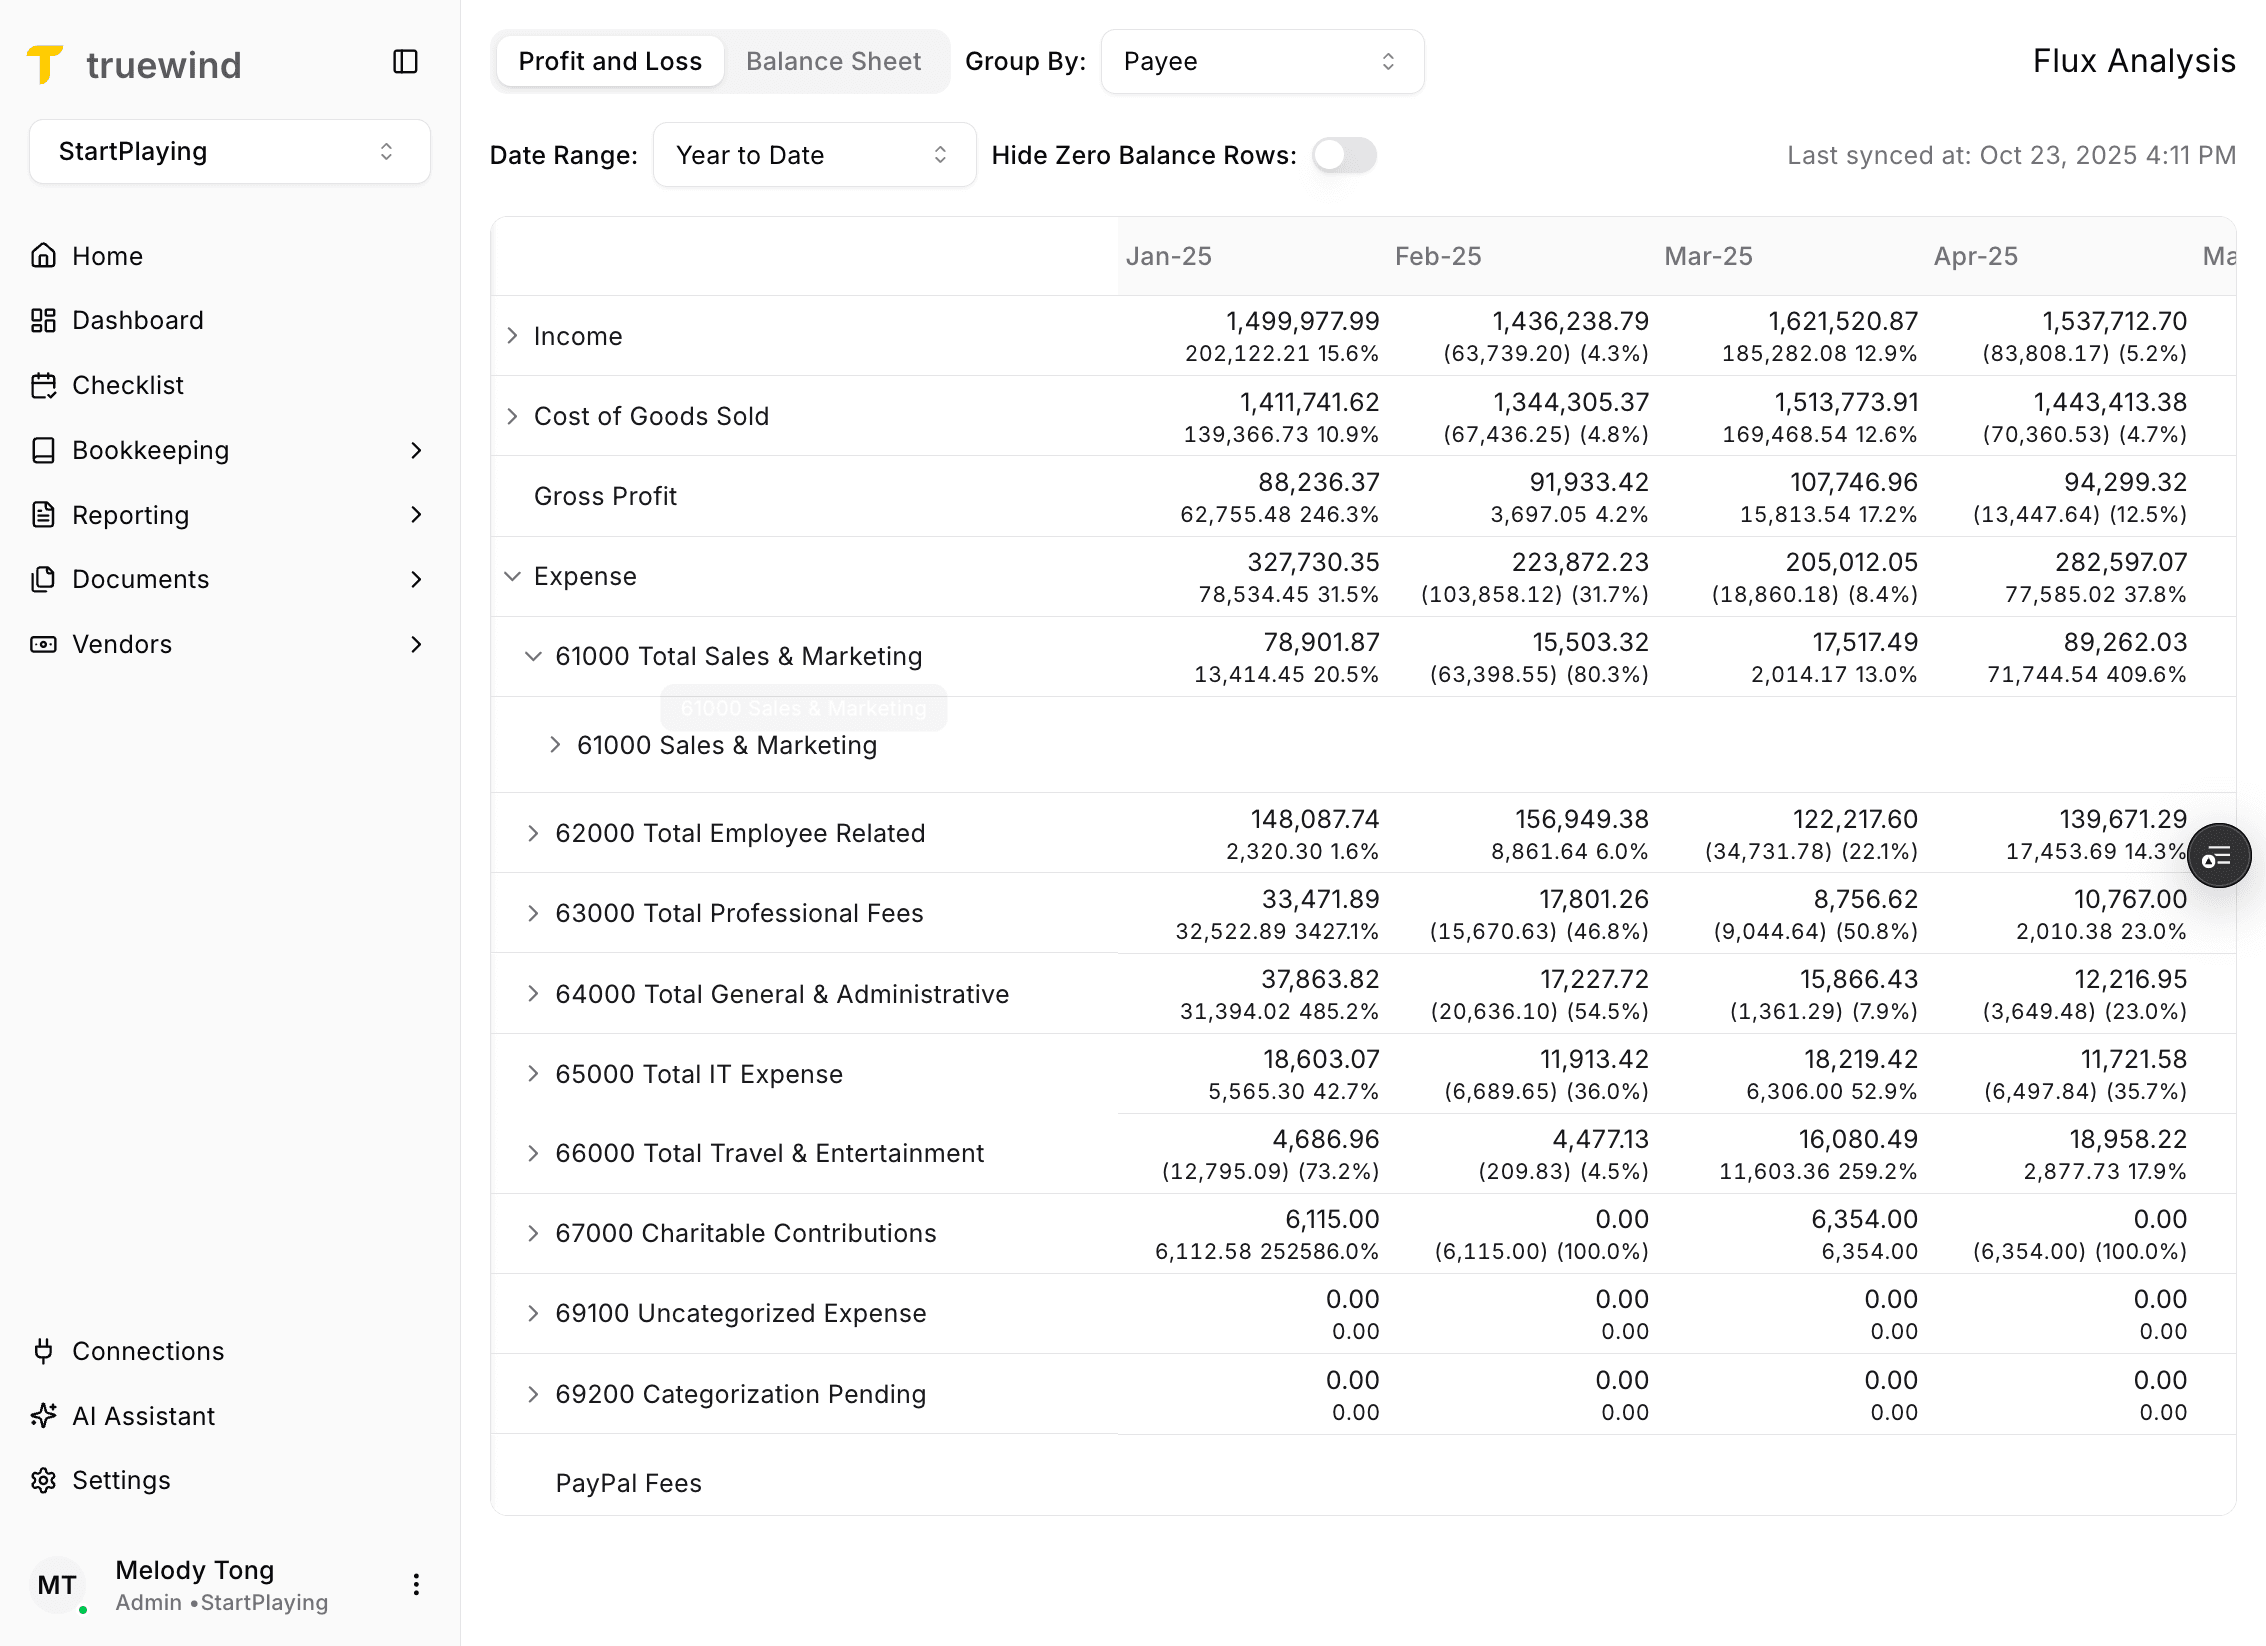
Step 10
Keep expanding until you reach the level where the variance is easier to interpret.
Step 11
Continue drilling down when you need sub-account or vendor-level context instead of only the rolled-up balance.
Step 12
Use one more expansion when the final vendor-level detail is still hidden beneath the current row.
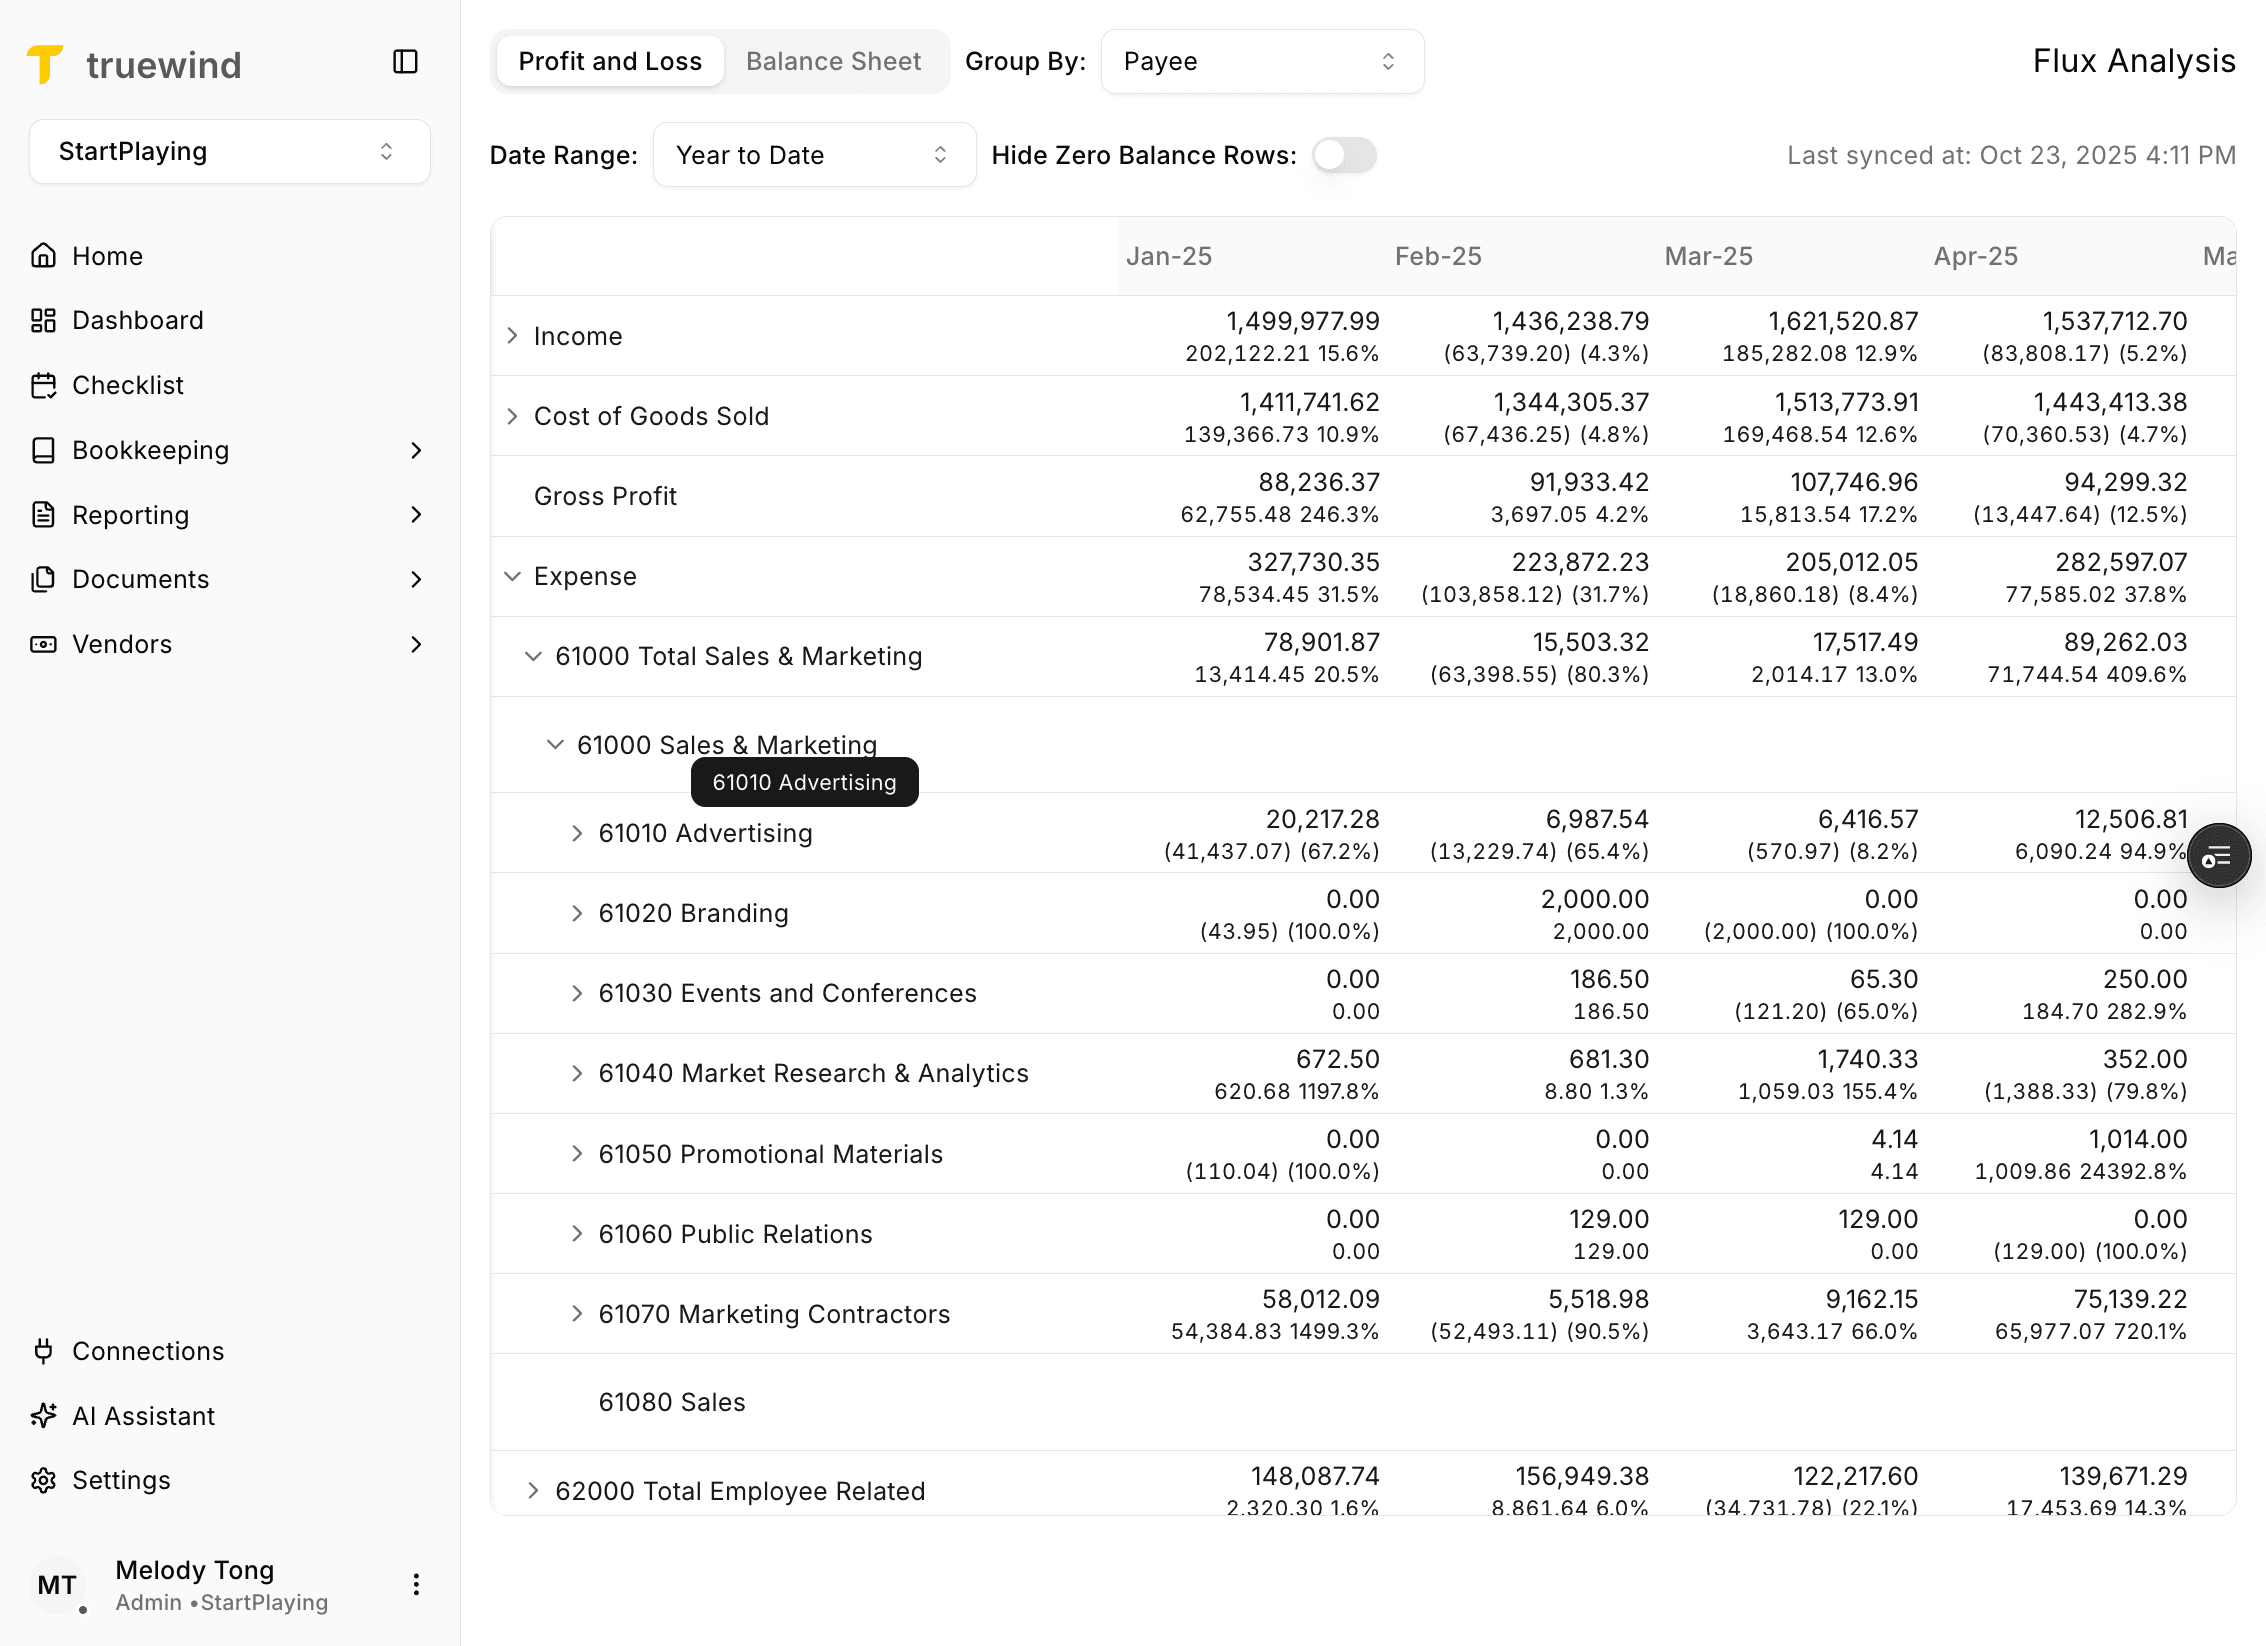
Step 13
At the vendor level, the table shows which balances are driving the account movement.
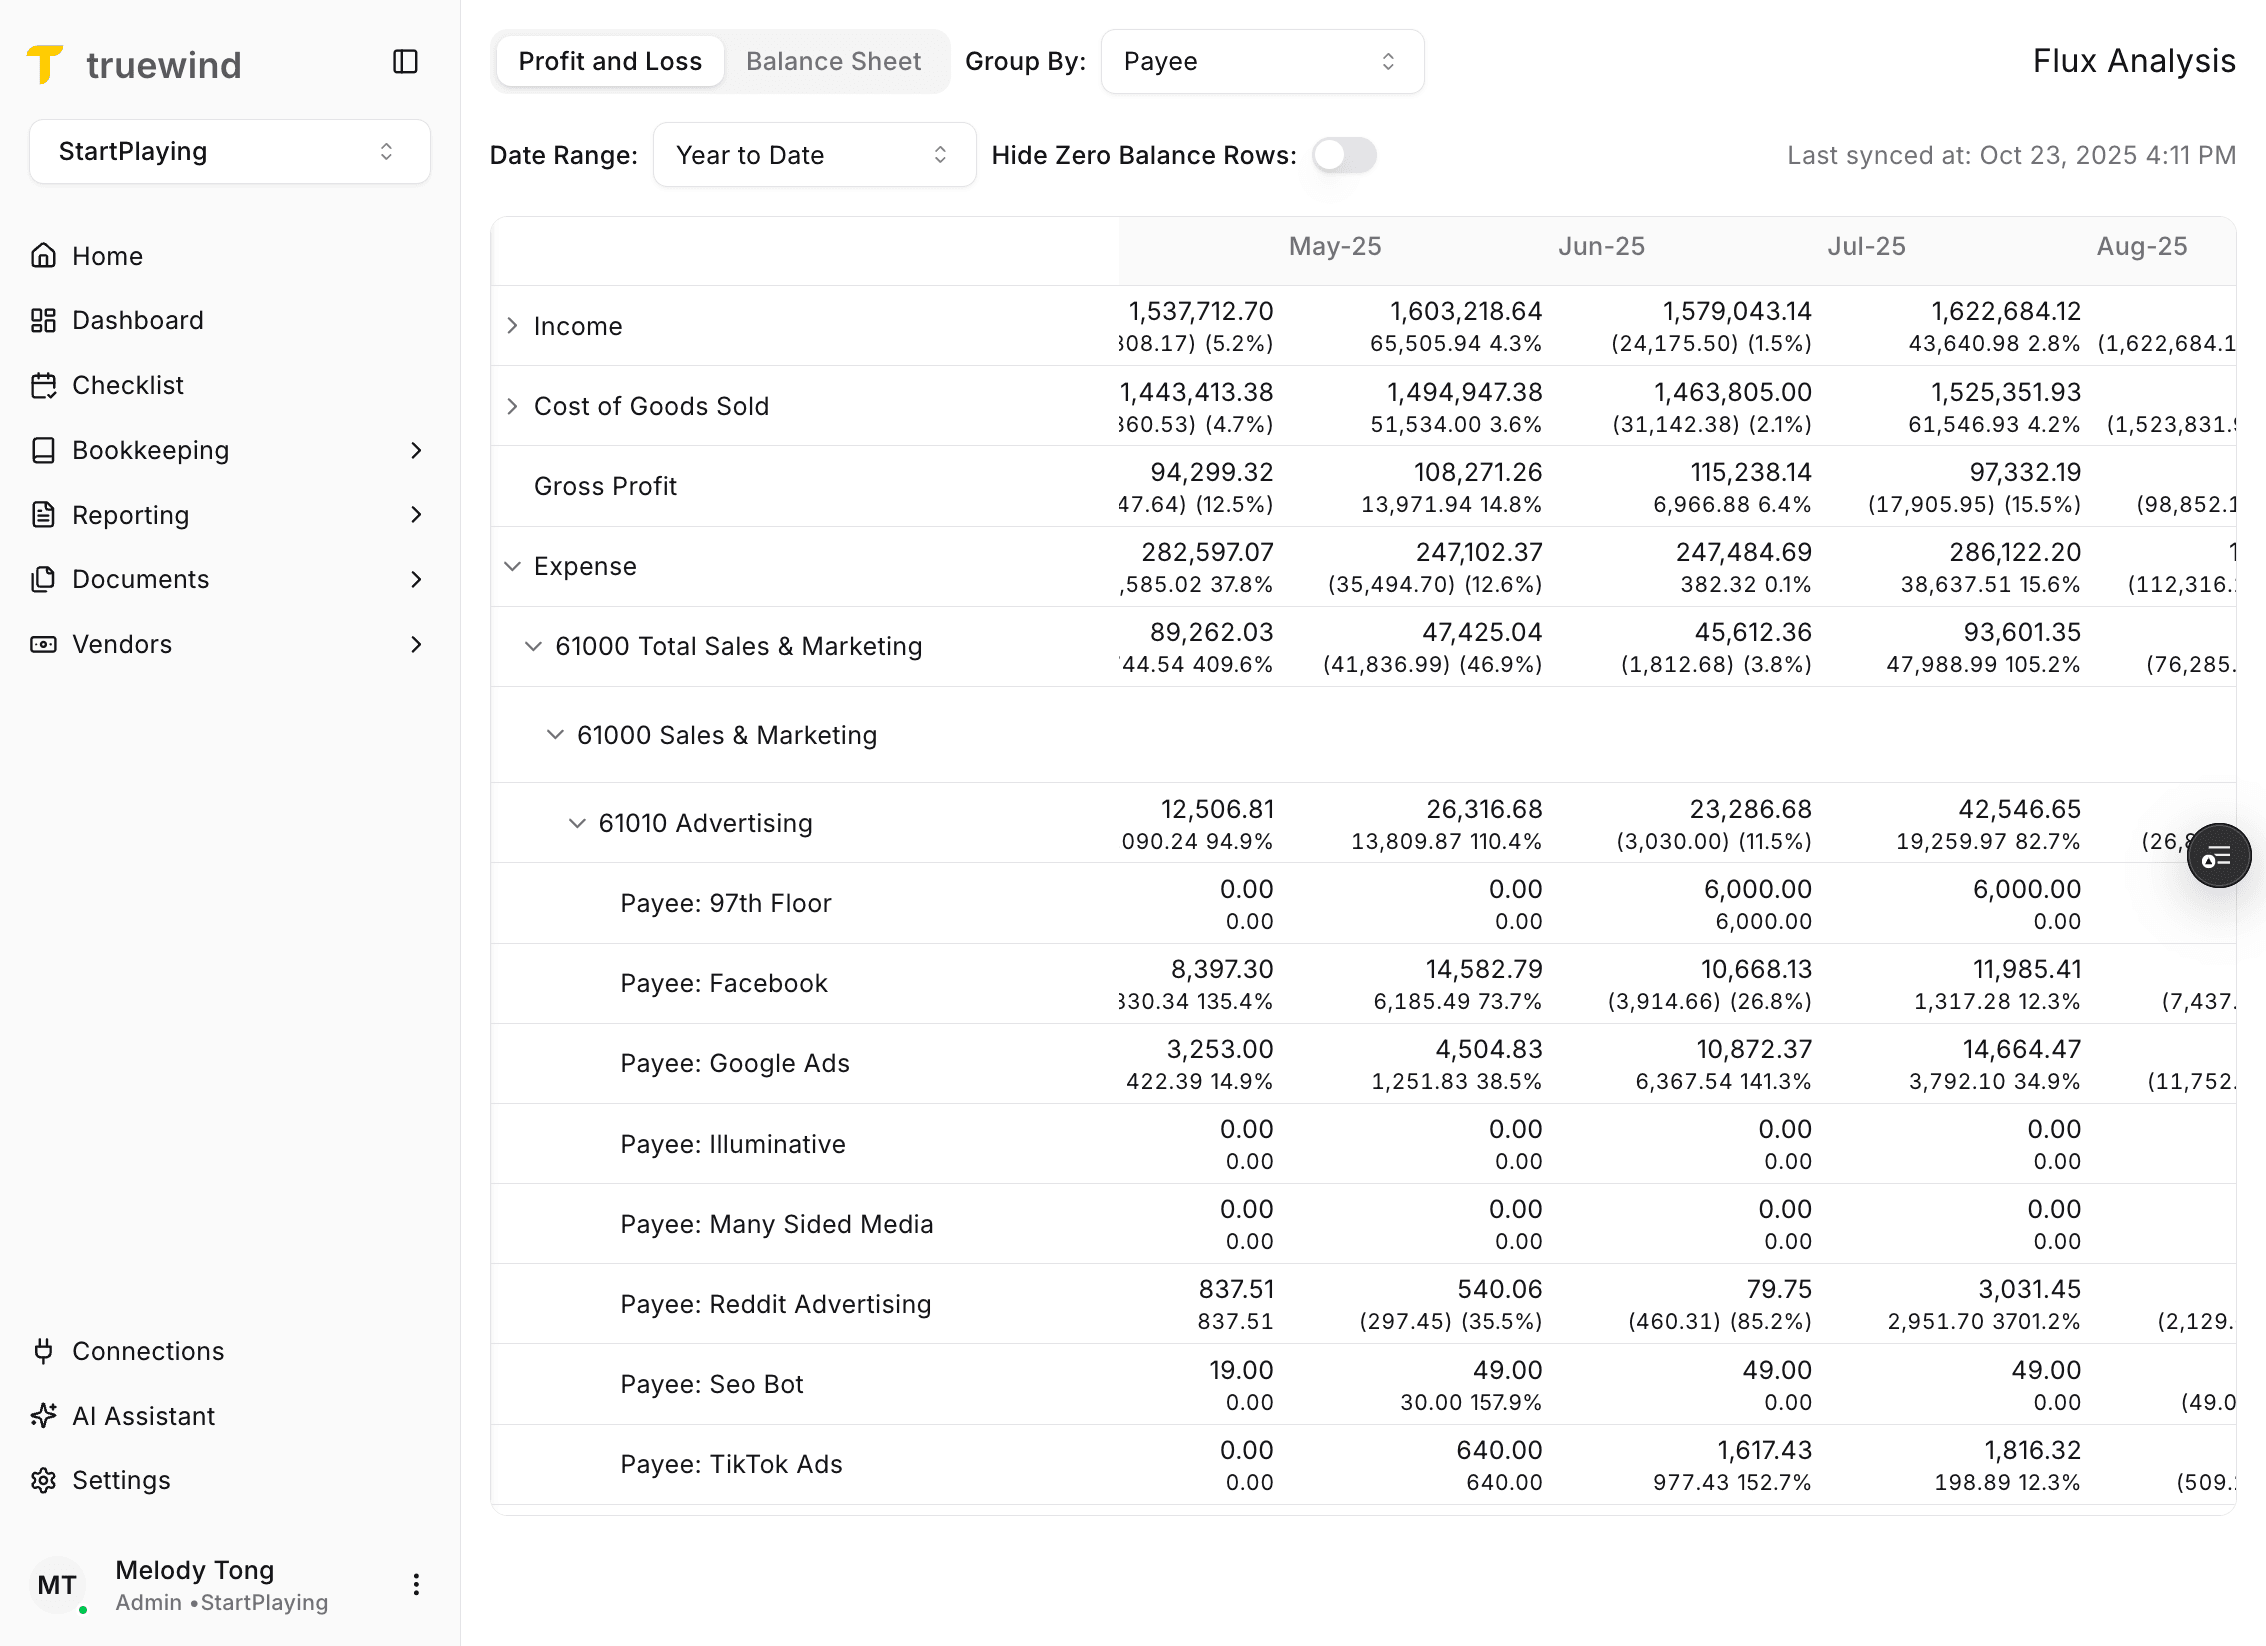
Step 14
Each month shows both percentage and dollar variance so you can evaluate magnitude as well as change rate.
Step 15
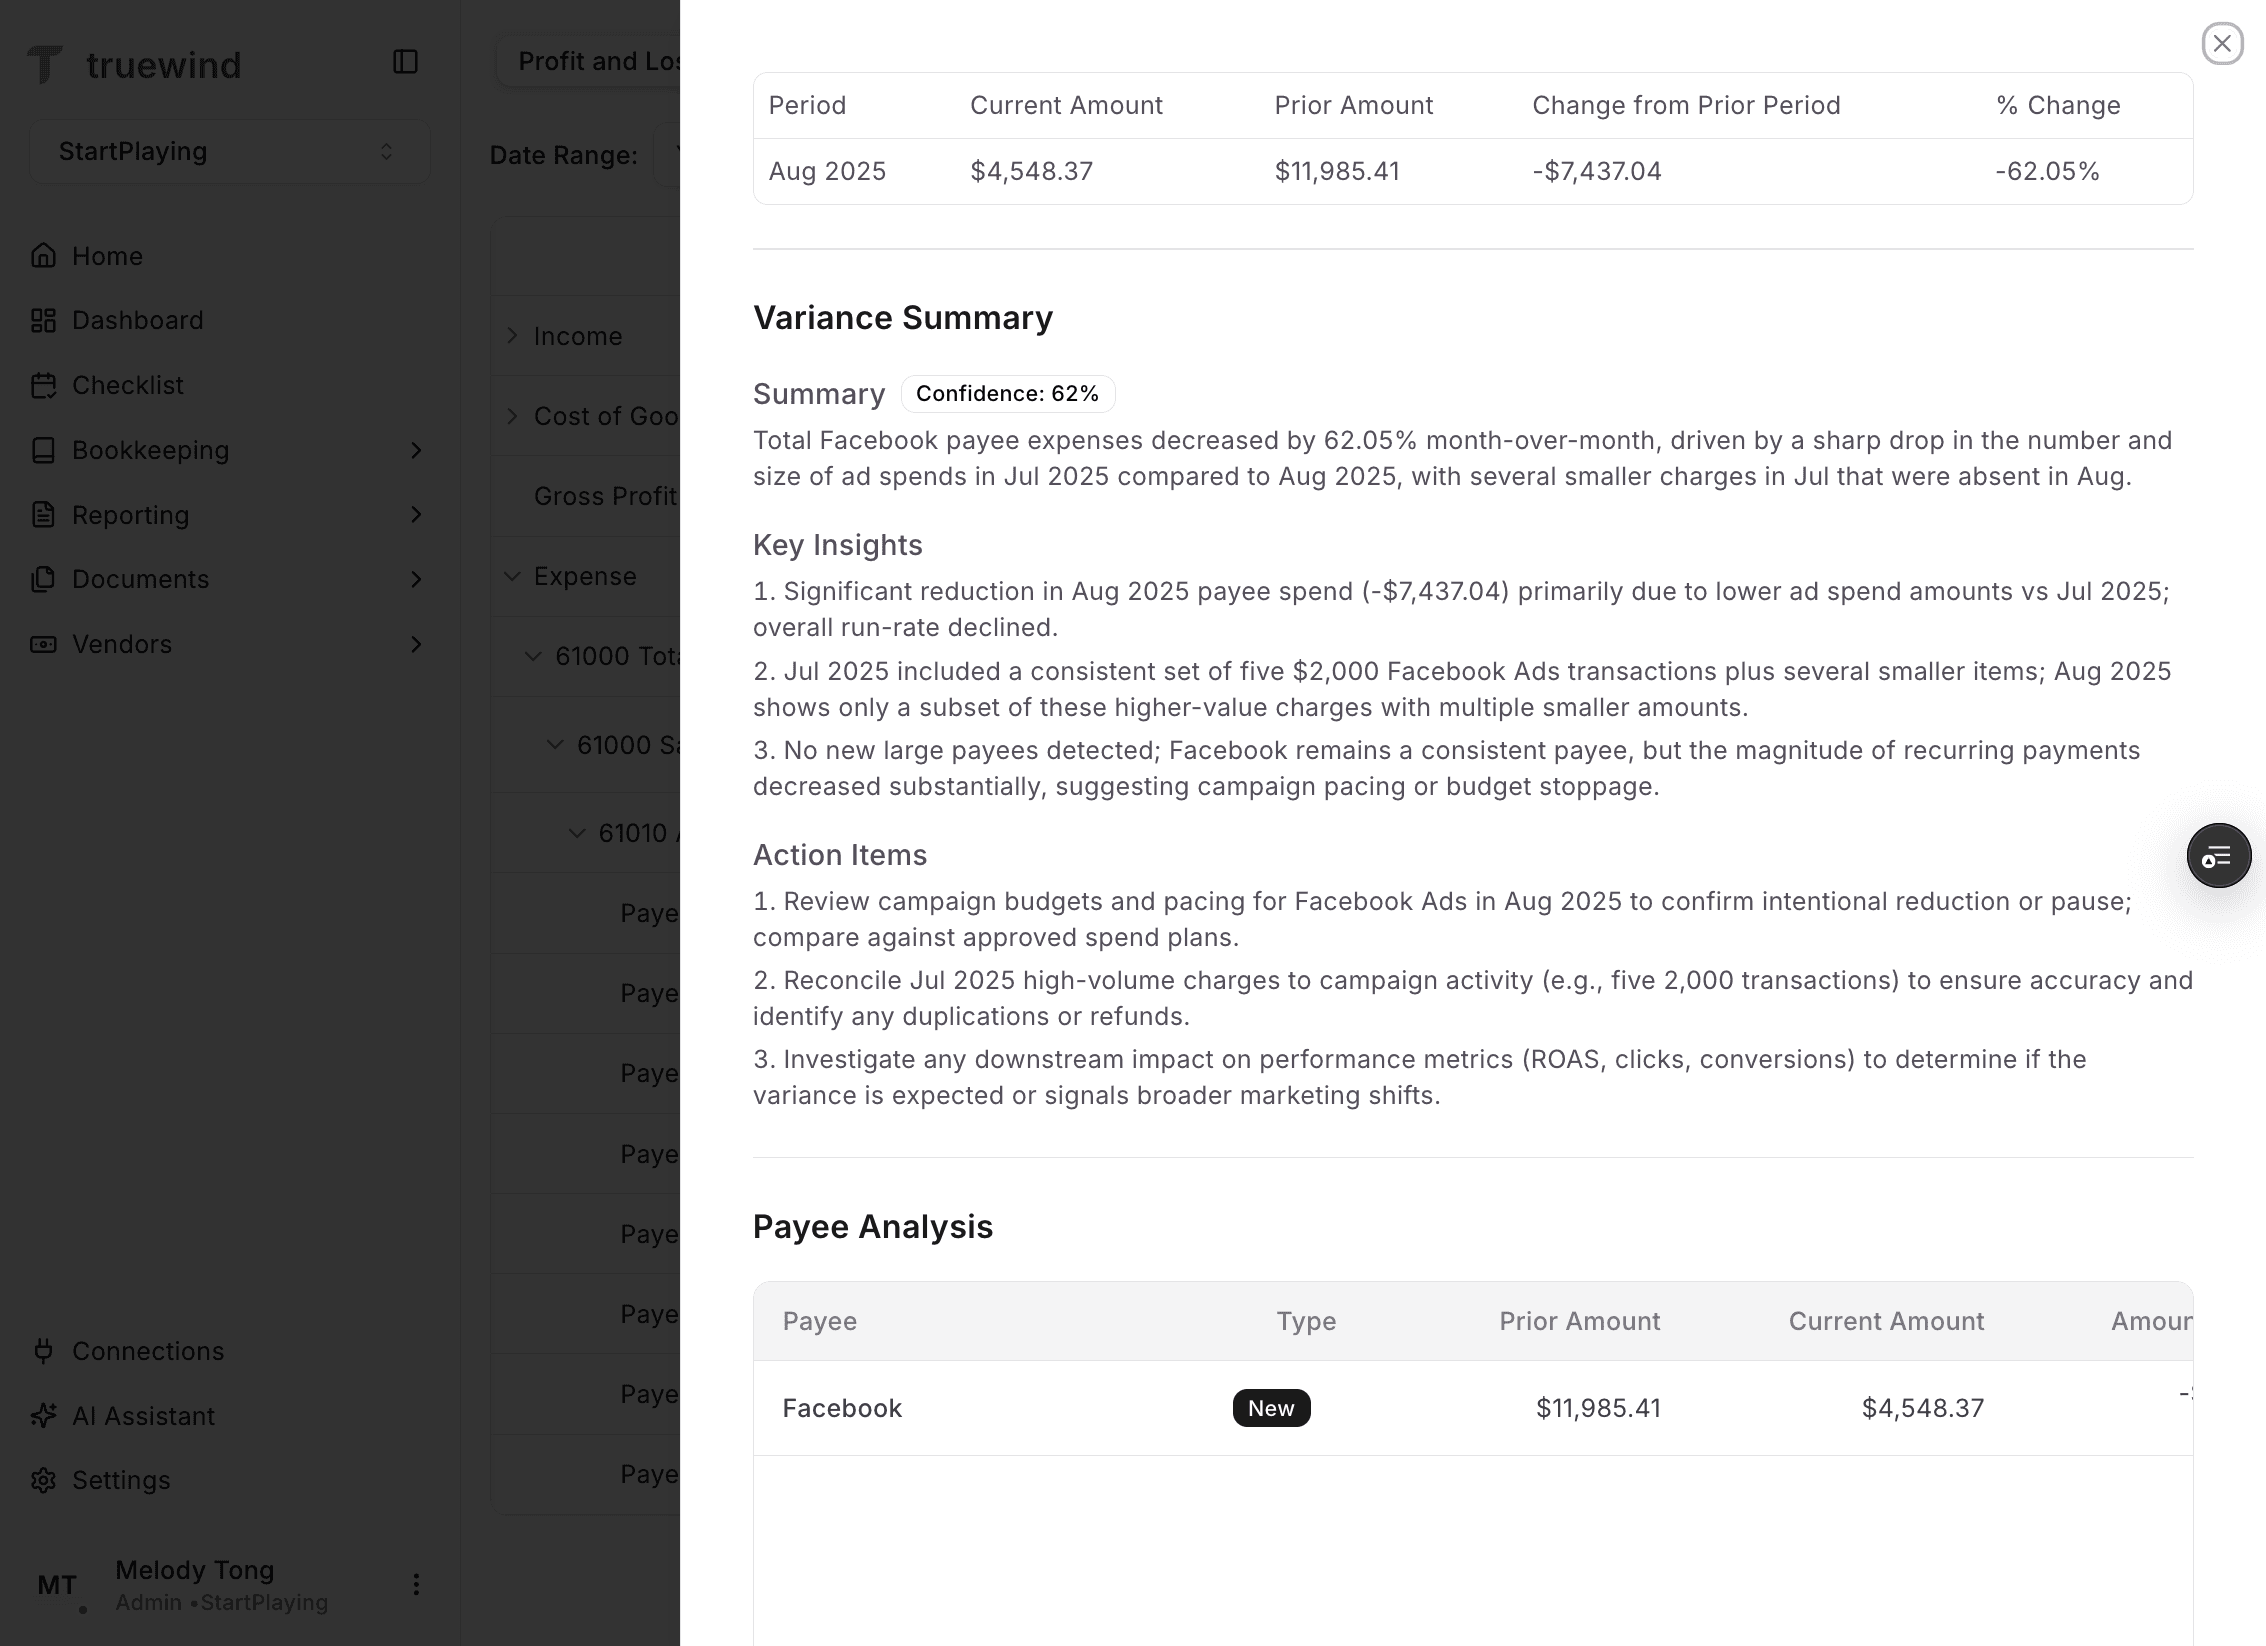
Click a balance cell to open the side drawer and review the AI-generated variance summary for that movement.
Confirm the selected view, grouping, Hide Zero Balance Rows setting, and date range before you interpret any variance, because those controls can change the meaning of the table quickly.
Flux Analysis supports both Profit and Loss and Balance Sheet views, so you can investigate movement in either reporting surface.
The Tango workflow shows Flux Analysis syncing every 12 hours, and the latest sync timestamp appears in the upper-right area of the page.
If the ERP is not connected or the latest sync has not finished, the analysis may be incomplete or unavailable.
Additional Group By options appear only when the relevant dimensions exist in the connected ERP data.
Check the selected date range, grouping, and Hide Zero Balance Rows setting before assuming the data is missing.
Expand the parent account into sub-account and vendor levels, then open the side drawer from the balance cell to review the variance summary.
Was this helpful?
Need more help?
Ask for human help about this article and provide any feedback.